Abercrombie & Fitch 2013 Annual Report Download - page 30
Download and view the complete annual report
Please find page 30 of the 2013 Abercrombie & Fitch annual report below. You can navigate through the pages in the report by either clicking on the pages listed below, or by using the keyword search tool below to find specific information within the annual report.-
 1
1 -
2
-
3
-
4
-
5
-
6
-
7
-
8
-
9
-
10
-
11
-
12
-
13
-
14
-
15
-
16
-
17
-
18
-
19
-
 20
20 -
 21
21 -
 22
22 -
 23
23 -
 24
24 -
 25
25 -
 26
26 -
 27
27 -
 28
28 -
 29
29 -
 30
30 -
 31
31 -
 32
32 -
 33
33 -
 34
34 -
 35
35 -
 36
36 -
 37
37 -
 38
38 -
 39
39 -
 40
40 -
41
-
42
-
43
-
44
-
45
-
46
-
47
-
48
-
49
-
50
-
51
-
52
-
53
-
54
-
55
-
56
-
57
-
58
-
59
-
60
-
61
-
62
-
63
-
64
-
65
-
66
-
67
-
68
-
69
-
70
-
71
-
72
-
73
-
74
-
75
-
76
-
77
-
78
-
79
-
80
-
81
-
82
-
83
-
84
-
85
-
86
-
87
-
88
-
89
-
90
-
91
-
92
-
93
-
94
-
95
-
96
-
97
-
98
-
99
-
100
-
101
-
102
-
103
-
104
-
105
-
106
-
107
-
108
-
109
-
110
-
111
-
112
-
113
-
114
-
115
-
116
 |
 |

30
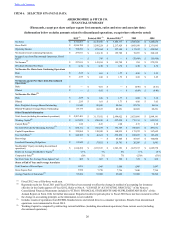
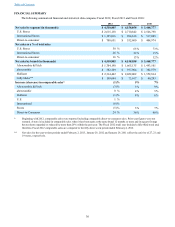
FINANCIAL SUMMARY
The following summarized financial and statistical data compares Fiscal 2012, Fiscal 2011 and Fiscal 2010:
2012 2011 2010
Net sales by segment (in thousands) $ 4,510,805 $ 4,158,058 $ 3,468,777
U.S. Stores $ 2,615,138 $ 2,710,842 $ 2,546,798
International Stores $ 1,195,016 $ 894,616 $ 517,005
Direct-to-consumer $ 700,651 $ 552,600 $ 404,974
Net sales as a % of total sales
U.S. Stores 58 % 65 % 73 %
International Stores 26 % 22 % 15 %
Direct-to-consumer 16 % 13 % 12 %
Net sales by brand (in thousands) $ 4,510,805 $ 4,158,058 $ 3,468,777
Abercrombie & Fitch $ 1,704,190 $ 1,665,135 $ 1,493,101
abercrombie $ 382,509 $ 397,904 $ 382,579
Hollister $ 2,314,462 $ 2,022,002 $ 1,552,814
Gilly Hicks** $ 109,644 $ 73,017 $ 40,283
Increase (decrease) in comparable sales* (1)% 5% 7%
Abercrombie & Fitch (3)% 3 % 9 %
abercrombie 0 % 4 % 5 %
Hollister (1)% 8 % 6 %
U.S. 1 %
International (8)%
Stores (5)% 5 % 7 %
Direct-to-Consumer 24 % 36 % 40 %
* Beginning with 2012, comparable sales were reported including comparable direct-to-consumer sales. Prior year figures were not
restated. A store is included in comparable sales when it has been open as the same brand 12 months or more and its square footage
has not been expanded or reduced by more than 20% within the past year. The Fiscal 2012 retail year included a fifty-third week and,
therefore, Fiscal 2012 comparable sales are compared to the fifty-three week period ended February 4, 2012.
** Net sales for the year-to-date periods ended February 2, 2013, January 28, 2012 and January 29, 2011 reflect the activity of 27, 21 and
19 stores, respectively.
Table of Contents