Abercrombie & Fitch 2013 Annual Report Download - page 46
Download and view the complete annual report
Please find page 46 of the 2013 Abercrombie & Fitch annual report below. You can navigate through the pages in the report by either clicking on the pages listed below, or by using the keyword search tool below to find specific information within the annual report.-
 1
1 -
2
-
3
-
4
-
5
-
6
-
7
-
8
-
9
-
10
-
11
-
12
-
13
-
14
-
15
-
16
-
17
-
18
-
19
-
20
-
21
-
22
-
23
-
24
-
25
-
26
-
27
-
28
-
29
-
30
-
31
-
32
-
33
-
34
-
35
-
 36
36 -
 37
37 -
 38
38 -
 39
39 -
 40
40 -
 41
41 -
 42
42 -
 43
43 -
 44
44 -
 45
45 -
 46
46 -
 47
47 -
 48
48 -
 49
49 -
 50
50 -
 51
51 -
 52
52 -
 53
53 -
 54
54 -
 55
55 -
 56
56 -
57
-
58
-
59
-
60
-
61
-
62
-
63
-
64
-
65
-
66
-
67
-
68
-
69
-
70
-
71
-
72
-
73
-
74
-
75
-
76
-
77
-
78
-
79
-
80
-
81
-
82
-
83
-
84
-
85
-
86
-
87
-
88
-
89
-
90
-
91
-
92
-
93
-
94
-
95
-
96
-
97
-
98
-
99
-
100
-
101
-
102
-
103
-
104
-
105
-
106
-
107
-
108
-
109
-
110
-
111
-
112
-
113
-
114
-
115
-
116
 |
 |
46
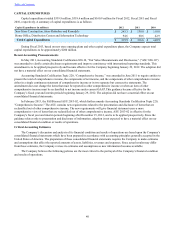
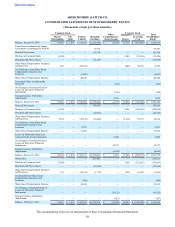
ITEM 8. FINANCIAL STATEMENTS AND SUPPLEMENTARY DATA
ABERCROMBIE & FITCH CO.
CONSOLIDATED STATEMENTS OF OPERATIONS AND COMPREHENSIVE INCOME
(Thousands, except share and per share amounts)
2012 2011 2010
(Restated see Note 4)
NET SALES $ 4,510,805 $ 4,158,058 $ 3,468,777
Cost of Goods Sold 1,694,096 1,607,834 1,251,348
GROSS PROFIT 2,816,709 2,550,224 2,217,429
Stores and Distribution Expense 1,987,926 1,888,248 1,589,501
Marketing, General and Administrative Expense 473,883 437,120 400,804
Other Operating Expense (Income), Net (19,333) 3,472 (10,056)
OPERATING INCOME 374,233 221,384 237,180
Interest Expense, Net 7,288 3,577 3,362
INCOME FROM CONTINUING OPERATIONS BEFORE TAXES 366,945 217,807 233,818
Tax Expense from Continuing Operations 129,934 74,669 78,109
NET INCOME FROM CONTINUING OPERATIONS $ 237,011 $ 143,138 $ 155,709
INCOME FROM DISCONTINUED OPERATIONS, Net of Tax $ — $ 796 $ —
NET INCOME $ 237,011 $ 143,934 $ 155,709
NET INCOME PER SHARE FROM CONTINUING OPERATIONS:
BASIC $ 2.89 $ 1.65 $ 1.77
DILUTED $ 2.85 $ 1.60 $ 1.73
NET INCOME PER SHARE FROM DISCONTINUED OPERATIONS:
BASIC $ — $ 0.01 $ —
DILUTED $ — $ 0.01 $ —
NET INCOME PER SHARE:
BASIC $ 2.89 $ 1.66 $ 1.77
DILUTED $ 2.85 $ 1.61 $ 1.73
WEIGHTED-AVERAGE SHARES OUTSTANDING:
BASIC 81,940 86,848 88,061
DILUTED 83,175 89,537 89,851
DIVIDENDS DECLARED PER SHARE $ 0.70 $ 0.70 $ 0.70
OTHER COMPREHENSIVE INCOME (LOSS)
Foreign Currency Translation Adjustments $(427) $ (8,658) $ 3,238
Gains (Losses) on Marketable Securities, net of taxes of $(5,526) and
$366 for Fiscal 2011 and Fiscal 2010, respectively. — 9,409 (622)
Unrealized Gain (Loss) on Derivative Financial Instruments, net of
taxes of $2,361, $(1,216) and $188 for Fiscal 2012, Fiscal 2011 and
Fiscal 2010, respectively. (19,152) 12,217 (320)
Other Comprehensive (Loss) Income $(19,579) $ 12,968 $ 2,296
COMPREHENSIVE INCOME $ 217,432 $ 156,902 $ 158,005
The accompanying Notes are an integral part of these Consolidated Financial Statements.
Table of Contents