Abercrombie & Fitch 2013 Annual Report Download - page 32
Download and view the complete annual report
Please find page 32 of the 2013 Abercrombie & Fitch annual report below. You can navigate through the pages in the report by either clicking on the pages listed below, or by using the keyword search tool below to find specific information within the annual report.-
 1
1 -
2
-
3
-
4
-
5
-
6
-
7
-
8
-
9
-
10
-
11
-
12
-
13
-
14
-
15
-
16
-
17
-
18
-
19
-
20
-
21
-
 22
22 -
 23
23 -
 24
24 -
 25
25 -
 26
26 -
 27
27 -
 28
28 -
 29
29 -
 30
30 -
 31
31 -
 32
32 -
 33
33 -
 34
34 -
 35
35 -
 36
36 -
 37
37 -
 38
38 -
 39
39 -
 40
40 -
 41
41 -
 42
42 -
43
-
44
-
45
-
46
-
47
-
48
-
49
-
50
-
51
-
52
-
53
-
54
-
55
-
56
-
57
-
58
-
59
-
60
-
61
-
62
-
63
-
64
-
65
-
66
-
67
-
68
-
69
-
70
-
71
-
72
-
73
-
74
-
75
-
76
-
77
-
78
-
79
-
80
-
81
-
82
-
83
-
84
-
85
-
86
-
87
-
88
-
89
-
90
-
91
-
92
-
93
-
94
-
95
-
96
-
97
-
98
-
99
-
100
-
101
-
102
-
103
-
104
-
105
-
106
-
107
-
108
-
109
-
110
-
111
-
112
-
113
-
114
-
115
-
116
 |
 |

32
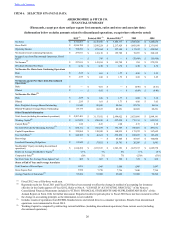
The following measurements are among the key business indicators reviewed by various members of management to gauge the
Company’s results:
• Comparable sales, defined as year-over-year sales for a store that has been open as the same brand at least one year and
its square footage has not been expanded or reduced by more than 20% within the past year combined with direct to
consumer sales;
• Direct-to-consumer sales growth;
• U.S. and International store performance;
• Store productivity;
• Selling margin, defined as sales price less original cost, by brand and by product category;
• Stores and distribution expense as a percentage of net sales;
• Marketing, general and administrative expense as a percentage of net sales;
• Operating income and operating income as a percentage of net sales;
• Net income;
• Inventory per gross square foot;
• Cash flow and liquidity determined by the Company’s current ratio and free cash flow; and
• Store metrics such as sales per gross square foot, sales per selling square foot, average unit retail, average number of
transactions per store, average transaction values, store contribution (defined as store sales less direct costs of operating
the store), and average units per transaction.
While not all of these metrics are disclosed publicly by the Company due to the proprietary nature of the information, the
Company publicly discloses and discusses many of these metrics as part of its “Financial Summary” and in several sections
within this Management’s Discussion and Analysis of Financial Condition and Results of Operations.
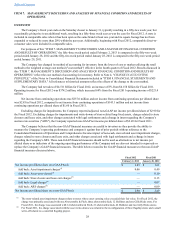
FISCAL 2012 COMPARED TO FISCAL 2011
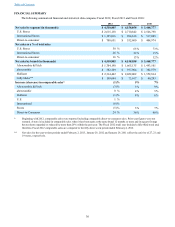
Net Sales
Net sales for Fiscal 2012 were $4.511 billion, an increase of 8% from Fiscal 2011 net sales of $4.158 billion. The net
sales increase was attributable to new stores, primarily international and a 27% increase in the direct-to-consumer business,
including shipping and handling revenue offset by a decrease of 5% from comparable store sales. The impact of foreign
currency on sales (based on converting prior year sales at current year exchange rates) adversely affected Fiscal 2012 by $26.3
million and benefited Fiscal 2011 by $21.6 million.
The Fiscal 2012 retail year includes a fifty-third week and, therefore, Fiscal 2012 comparable sales are compared to the
fifty-three week period ended February 4, 2012. The fifty-third week added approximately $62.8 million of sales to the
comparable base, being sales for the week ended February 4, 2012.
Total U.S. sales, including direct-to-consumer, for Fiscal 2012 were $3.087 billion, a decrease of 1% from Fiscal 2011
sales of $3.108 billion. Total international sales, including direct-to-consumer, for Fiscal 2012 were $1.424 billion, an increase
of 36% from Fiscal 2011 sales of $1.050 billion.
Direct-to-consumer sales in Fiscal 2012, including shipping and handling revenue, were $700.7 million, an increase of
27% from Fiscal 2011 direct-to-consumer sales of $552.6 million. The direct-to-consumer business, including shipping and
handling revenue, accounted for 16% of total net sales in Fiscal 2012 compared to 13% in Fiscal 2011.
Total comparable sales for the year, including direct-to-consumer sales, decreased 1% with comparable store sales
decreasing 5% and comparable direct-to-consumer sales increasing by 24%. Comparable sales for Fiscal 2012 increased 1% for
the U.S., with comparable store sales decreasing by 1% and comparable direct-to-consumer sales up 15%. Comparable sales for
the full year decreased 8% for international, with comparable store sales decreasing by 19% and comparable direct-to-
consumer sales up 46%.
For Fiscal 2012, comparable sales by brand, including direct-to-consumer sales, decreased 3% for Abercrombie & Fitch,
were flat for abercrombie kids, and decreased 1% for Hollister Co. Across the brands, male performed better than female.
From a merchandise classification standpoint, outerwear and jeans were stronger performing categories for the male
business while polos and sport shirts were weaker performing categories. In the female business, woven shirts, sweaters, and
knit tops were stronger performing categories, while fleece, sweatpants and graphics were weaker performing categories.
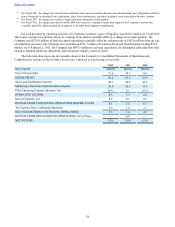
Gross Profit
Table of Contents