Abercrombie & Fitch 2013 Annual Report Download - page 26
Download and view the complete annual report
Please find page 26 of the 2013 Abercrombie & Fitch annual report below. You can navigate through the pages in the report by either clicking on the pages listed below, or by using the keyword search tool below to find specific information within the annual report.-
 1
1 -
2
-
3
-
4
-
5
-
6
-
7
-
8
-
9
-
10
-
11
-
12
-
13
-
14
-
15
-
 16
16 -
 17
17 -
 18
18 -
 19
19 -
 20
20 -
 21
21 -
 22
22 -
 23
23 -
 24
24 -
 25
25 -
 26
26 -
 27
27 -
 28
28 -
 29
29 -
 30
30 -
 31
31 -
 32
32 -
 33
33 -
 34
34 -
 35
35 -
 36
36 -
37
-
38
-
39
-
40
-
41
-
42
-
43
-
44
-
45
-
46
-
47
-
48
-
49
-
50
-
51
-
52
-
53
-
54
-
55
-
56
-
57
-
58
-
59
-
60
-
61
-
62
-
63
-
64
-
65
-
66
-
67
-
68
-
69
-
70
-
71
-
72
-
73
-
74
-
75
-
76
-
77
-
78
-
79
-
80
-
81
-
82
-
83
-
84
-
85
-
86
-
87
-
88
-
89
-
90
-
91
-
92
-
93
-
94
-
95
-
96
-
97
-
98
-
99
-
100
-
101
-
102
-
103
-
104
-
105
-
106
-
107
-
108
-
109
-
110
-
111
-
112
-
113
-
114
-
115
-
116
 |
 |
26
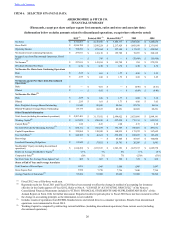
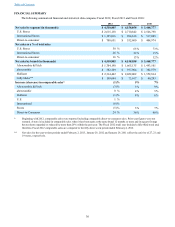
ITEM 6. SELECTED FINANCIAL DATA.
ABERCROMBIE & FITCH CO.
FINANCIAL SUMMARY
(Thousands, except per share and per square foot amounts, ratios and store and associate data)
(Information below excludes amounts related to discontinued operations, except where otherwise noted)
2012 (1) Restated 2011 (2) Restated 2010 (2) 2009 2008
Net Sales $ 4,510,805 $ 4,158,058 $ 3,468,777 $ 2,928,626 $ 3,484,058
Gross Profit $ 2,816,709 $ 2,550,224 $ 2,217,429 $ 1,883,598 $ 2,331,095
Operating Income $ 374,233 $ 221,384 $ 237,180 $ 117,912 $ 498,262
Net Income from Continuing Operations $ 237,011 $ 143,138 $ 155,709 $ 78,953 $ 308,169
Income (Loss) from Discontinued Operations, Net of
Tax(3) —$ 796 $ — $ (78,699) $ (35,914)
Net Income(3) $ 237,011 $ 143,934 $ 155,709 $ 254 $ 272,255
Dividends Declared Per Share $ 0.70 $ 0.70 $ 0.70 $ 0.70 $ 0.70
Net Income Per Share from Continuing Operations
Basic $ 2.89 $ 1.65 $ 1.77 $ 0.90 $ 3.55
Diluted $ 2.85 $ 1.60 $ 1.73 $ 0.89 $ 3.45
Net Income (Loss) Per Share from Discontinued
Operations(3)
Basic $ — $ 0.01 $ — $ (0.90) $ (0.41)
Diluted $ — $ 0.01 $ — $ (0.89) $ (0.40)
Net Income Per Share(3)
Basic $ 2.89 $ 1.66 $ 1.77 $ 0.00 $ 3.14
Diluted $ 2.85 $ 1.61 $ 1.73 $ 0.00 $ 3.05
Basic Weighted-Average Shares Outstanding 81,940 86,848 88,061 87,874 86,816
Diluted Weighted-Average Shares Outstanding 83,175 89,537 89,851 88,609 89,291
Other Financial Information
Total Assets (including discontinued operations) $ 2,987,401 $ 3,117,032 $ 2,994,022 $ 2,821,866 $ 2,848,181
Working Capital(4) $ 617,023 $ 858,248 $ 927,024 $ 776,311 $ 622,213
Current Ratio(5) 1.89 2.23 2.68 2.73 2.38
Net Cash Provided by Operating Activities(3) $ 684,171 $ 365,219 $ 391,789 $ 395,487 $ 491,031
Capital Expenditures $ 339,862 $ 318,598 $ 160,935 $ 175,472 $ 367,602
Free Cash Flow(6) $ 344,309 $ 46,621 $ 230,854 $ 220,015 $ 123,429
Borrowings — — $ 43,805 $ 50,927 $ 100,000
Leasehold Financing Obligations $ 63,942 $ 57,851 $ 24,761 $ 20,286 $ 5,881
Stockholders’ Equity (including discontinued
operations) $ 1,818,268 $ 1,931,335 $ 1,943,391 $ 1,827,917 $ 1,845,578
Return on Average Stockholders’ Equity(7) 13 % 7% 8% 0 % 16 %
Comparable Sales(8) (1)% 5% 7% (23)% (13)%
Net Store Sales Per Average Gross Square Foot $ 485 $ 463 $ 390 $ 339 $ 432
Stores at End of Year and Average Associates
Total Number of Stores Open 1,051 1,045 1,069 1,096 1,097
Gross Square Feet 7,958 7,778 7,756 7,848 7,760
Average Number of Associates(9) 95,800 91,000 83,000 83,000 96,200
(1) Fiscal 2012 was a fifty-three week year.
(2) Reported results for Fiscal 2011 and Fiscal 2010 have been restated to reflect the change in method of accounting for inventory
effective in the fourth quarter of Fiscal 2012. Refer to Note 4, “CHANGE IN ACCOUNTING PRINCIPLE,” of the Notes to
Consolidated Financial Statements included in “ITEM 8. FINANCIAL STATEMENTS AND SUPPLEMENTARY DATA” of this
Annual Report on Form 10-K for further discussion. Reported results for periods prior to Fiscal 2010 have not been restated to reflect
the change in accounting principle as the information is not available.
(3) Includes results of operations from RUEHL branded stores and related direct-to-consumer operations. Results from discontinued
operations were immaterial in Fiscal 2010.
(4) Working Capital is computed by subtracting current liabilities (including discontinued operations) from current assets (including
discontinued operations).
Table of Contents