Abercrombie & Fitch 2013 Annual Report Download - page 33
Download and view the complete annual report
Please find page 33 of the 2013 Abercrombie & Fitch annual report below. You can navigate through the pages in the report by either clicking on the pages listed below, or by using the keyword search tool below to find specific information within the annual report.-
 1
1 -
2
-
3
-
4
-
5
-
6
-
7
-
8
-
9
-
10
-
11
-
12
-
13
-
14
-
15
-
16
-
17
-
18
-
19
-
20
-
21
-
22
-
 23
23 -
 24
24 -
 25
25 -
 26
26 -
 27
27 -
 28
28 -
 29
29 -
 30
30 -
 31
31 -
 32
32 -
 33
33 -
 34
34 -
 35
35 -
 36
36 -
 37
37 -
 38
38 -
 39
39 -
 40
40 -
 41
41 -
 42
42 -
 43
43 -
44
-
45
-
46
-
47
-
48
-
49
-
50
-
51
-
52
-
53
-
54
-
55
-
56
-
57
-
58
-
59
-
60
-
61
-
62
-
63
-
64
-
65
-
66
-
67
-
68
-
69
-
70
-
71
-
72
-
73
-
74
-
75
-
76
-
77
-
78
-
79
-
80
-
81
-
82
-
83
-
84
-
85
-
86
-
87
-
88
-
89
-
90
-
91
-
92
-
93
-
94
-
95
-
96
-
97
-
98
-
99
-
100
-
101
-
102
-
103
-
104
-
105
-
106
-
107
-
108
-
109
-
110
-
111
-
112
-
113
-
114
-
115
-
116
 |
 |

33
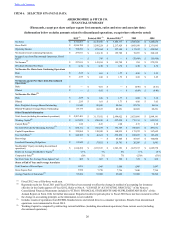
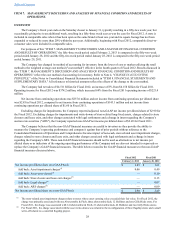
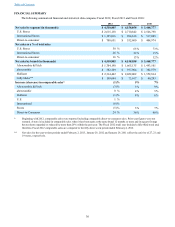
Gross profit during Fiscal 2012 was $2.817 billion compared to gross profit of $2.550 billion during Fiscal 2011. The
gross profit rate (gross profit divided by net sales) for Fiscal 2012 was 62.4%, up 110 basis points from the Fiscal 2011 rate of
61.3%.
The increase in the gross profit rate for Fiscal 2012 was primarily driven by a decrease in average unit cost.
Stores and Distribution Expense
Stores and distribution expense for Fiscal 2012 was $1.988 billion compared to $1.888 billion in Fiscal 2011. The stores
and distribution expense rate (stores and distribution expense divided by net sales) for Fiscal 2012 was 44.1% compared to
45.4% in Fiscal 2011.
Stores and distribution expense for Fiscal 2012 included store-related asset impairment charges of $7.4 million primarily
associated with 17 stores. For Fiscal 2011, stores and distribution expense included store-related asset impairment charges of
$68.0 million associated with 79 stores, asset write-down charges of $14.6 million related to the reconfiguration of three
flagship stores and a small write-off related to a cancelled flagship project, and store exit charges of $19.0 million, associated
with lease buyouts and other lease obligations related to stores closing prior to natural lease expirations, other lease
terminations, and other incidental costs associated with store closures. Excluding the effect of these charges, the stores and
distribution expense rate was 43.9% for Fiscal 2012 compared to 43.0% last year. The increase in stores and distribution
expense rate for Fiscal 2012 was primarily the result of deleveraging on negative comparable store sales and higher direct-to-
consumer expense.
Shipping and handling costs, including costs incurred to store, move and prepare merchandise for shipment and costs
incurred to physically move the product to the customer, associated with direct-to-consumer operations were $78.6 million and
$53.6 million for Fiscal 2012 and Fiscal 2011, respectively. The increase in shipping and handling costs in Fiscal 2012 was
primarily driven by increased sales volume and a higher international mix component. These amounts are recorded in Stores
and Distribution Expense in our Consolidated Statements of Operations and Comprehensive Income.
Handling costs, including costs incurred to store, move and prepare merchandise for shipment to the stores were $59.4
million and $62.8 million for Fiscal 2012 and Fiscal 2011, respectively. These amounts are recorded in Stores and Distribution
Expense in our Consolidated Statements of Operations and Comprehensive Income.
Marketing, General and Administrative Expense
Marketing, general and administrative expense during Fiscal 2012 was $473.9 million compared to $437.1 million in
Fiscal 2011. The marketing, general and administrative expense rate (marketing, general and administrative expense divided by
net sales) was 10.5% in Fiscal 2012 and Fiscal 2011. Marketing, general and administrative expense for Fiscal 2011 included
$10.0 million in connection with legal settlements.
The increase in marketing, general, and administrative expenses was due to increases in incentive and other
compensation related expenses, IT, marketing and other expenses.
Other Operating Expense (Income), Net
Other operating income, net was $19.3 million for Fiscal 2012 compared to other operating expense, net of $3.5 million
for Fiscal 2011. Other operating income, net for Fiscal 2012, included income of $4.8 million related to business interruption
insurance recoveries associated with Superstorm Sandy. Other operating expense included a charge of $13.4 million related to
the Company’s change of intent regarding the sale of its ARS portfolio, which resulted in recognition of an other-than-
temporary impairment in Fiscal 2011.
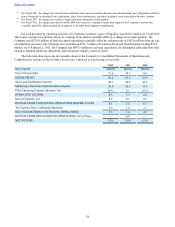
Operating Income
Operating income for Fiscal 2012 was $374.2 million compared to operating income of $221.4 million for Fiscal 2011.
Operating income growth by new international stores, existing U.S. stores and direct-to-consumer operations more than off-set
declines in existing international stores driven by negative comparable store sales and higher non-four wall expenses. Non-four
wall expenses include: marketing, general and administrative expense; store management and support functions such as
regional and district management and other functions not dedicated to an individual store; and distribution center costs.
Interest Expense (Income), Net and Tax Expense
Fiscal 2012 interest expense was $10.5 million, offset by interest income of $3.2 million, compared to interest expense of
$7.9 million, offset by interest income of $4.3 million for Fiscal 2011.
The effective tax rate for Fiscal 2012 was 35.4% compared to 34.3% for Fiscal 2011.
As of February 2, 2013, there were approximately $22.2 million of net deferred tax assets in Japan. The realization of the
net deferred tax assets is dependent upon the future generation of sufficient taxable profits in Japan. While the Company
Table of Contents