Abercrombie & Fitch 2013 Annual Report Download - page 48
Download and view the complete annual report
Please find page 48 of the 2013 Abercrombie & Fitch annual report below. You can navigate through the pages in the report by either clicking on the pages listed below, or by using the keyword search tool below to find specific information within the annual report.-
 1
1 -
2
-
3
-
4
-
5
-
6
-
7
-
8
-
9
-
10
-
11
-
12
-
13
-
14
-
15
-
16
-
17
-
18
-
19
-
20
-
21
-
22
-
23
-
24
-
25
-
26
-
27
-
28
-
29
-
30
-
31
-
32
-
33
-
34
-
35
-
36
-
37
-
 38
38 -
 39
39 -
 40
40 -
 41
41 -
 42
42 -
 43
43 -
 44
44 -
 45
45 -
 46
46 -
 47
47 -
 48
48 -
 49
49 -
 50
50 -
 51
51 -
 52
52 -
 53
53 -
 54
54 -
 55
55 -
 56
56 -
 57
57 -
 58
58 -
59
-
60
-
61
-
62
-
63
-
64
-
65
-
66
-
67
-
68
-
69
-
70
-
71
-
72
-
73
-
74
-
75
-
76
-
77
-
78
-
79
-
80
-
81
-
82
-
83
-
84
-
85
-
86
-
87
-
88
-
89
-
90
-
91
-
92
-
93
-
94
-
95
-
96
-
97
-
98
-
99
-
100
-
101
-
102
-
103
-
104
-
105
-
106
-
107
-
108
-
109
-
110
-
111
-
112
-
113
-
114
-
115
-
116
 |
 |

48
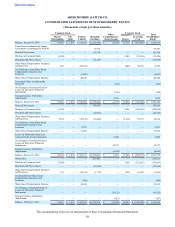
ABERCROMBIE & FITCH CO.
CONSOLIDATED STATEMENTS OF STOCKHOLDERS’ EQUITY
(Thousands, except per share amounts)
Common Stock
Paid-In
Capital Retained
Earnings
Other
Comprehensive
(Loss) Income
Treasury Stock Total
Stockholders’
Equity
Shares
Outstanding Par
Value Shares At Average
Cost
Balance, January 30, 2010 87,986 $ 1,033 $ 339,453 $ 2,183,690 $ (8,973) 15,314 $ (687,286) $ 1,827,917
Cumulative restatement for change
in inventory accounting (See Note 4) 47,341 47,341
Restated Net Income — — — 155,709 — — — 155,709
Purchase of Common Stock (1,582) — — — — 1,582 (76,158) (76,158)
Dividends ($0.70 per share) — — — (61,656) — — — (61,656)
Share-based Compensation Issuances
and Exercises 842 — (29,741) — — (842) 38,136 8,395
Tax Deficiency from Share-based
Compensation Issuances and
Exercises — — (1,053) — — — — (1,053)
Share-based Compensation Expense — — 40,599 — — — — 40,599
Unrealized Gains on Marketable
Securities — — — — (622) — (622)
Net Change in Unrealized Gains or
Losses on Derivative Financial
Instruments — — — — (320) — (320)
Foreign Currency Translation
Adjustments — — — — 3,238 — 3,238
Balance, January 29, 2011 87,246 $ 1,033 $ 349,258 $ 2,325,084 $ (6,677) 16,054 $ (725,308) $ 1,943,390
Restated Net Income — — — 143,934 — — — 143,934
Purchase of Common Stock (3,546) — — — — 3,546 (196,605) (196,605)
Dividends ($0.70 per share) — — — (60,956) — — — (60,956)
Share-based Compensation Issuances
and Exercises 1,938 — (34,153) (18,448) — (1,938) 87,139 34,538
Tax Deficiency from Share-based
Compensation Issuances and
Exercises — — 2,973 — — — — 2,973
Share-based Compensation Expense — — 51,093 — — — — 51,093
Losses on Marketable Securities
reclassed to the Income Statement — — — — 9,409 — 9,409
Net Change in Unrealized Gains or
Losses on Derivative Financial
Instruments — — — — 12,217 — 12,217
Foreign Currency Translation
Adjustments — — — — (8,658) — (8,658)
Balance, January 28, 2012 85,638 $ 1,033 $ 369,171 $ 2,389,614 $ 6,291 17,662 $ (834,774) $ 1,931,335
Net Income — — — 237,011 — — — 237,011
Purchase of Common Stock (7,548) — — — — 7,548 (321,665) (321,665)
Dividends ($0.70 per share) — — — (57,634) — — — (57,634)
Share-based Compensation Issuances
and Exercises 355 — (18,356) (1,730) — (355) 16,430 (3,656)
Tax Benefit from Share-based
Compensation Issuances and
Exercises — — (466) — — — — (466)
Share-based Compensation Expense — — 52,922 — — — — 52,922
Net Change in Unrealized Gains or
Losses on Derivative Financial
Instruments — — — — (19,152) — (19,152)
Foreign Currency Translation
Adjustments — — — — (427) — (427)
Balance, February 2, 2013 78,445 $ 1,033 $ 403,271 $ 2,567,261 $ (13,288) 24,855 $ (1,140,009) $ 1,818,268
The accompanying Notes are an integral part of these Consolidated Financial Statements.
Table of Contents