Abercrombie & Fitch 2013 Annual Report Download - page 51
Download and view the complete annual report
Please find page 51 of the 2013 Abercrombie & Fitch annual report below. You can navigate through the pages in the report by either clicking on the pages listed below, or by using the keyword search tool below to find specific information within the annual report.-
 1
1 -
2
-
3
-
4
-
5
-
6
-
7
-
8
-
9
-
10
-
11
-
12
-
13
-
14
-
15
-
16
-
17
-
18
-
19
-
20
-
21
-
22
-
23
-
24
-
25
-
26
-
27
-
28
-
29
-
30
-
31
-
32
-
33
-
34
-
35
-
36
-
37
-
38
-
39
-
40
-
 41
41 -
 42
42 -
 43
43 -
 44
44 -
 45
45 -
 46
46 -
 47
47 -
 48
48 -
 49
49 -
 50
50 -
 51
51 -
 52
52 -
 53
53 -
 54
54 -
 55
55 -
 56
56 -
 57
57 -
 58
58 -
 59
59 -
 60
60 -
 61
61 -
62
-
63
-
64
-
65
-
66
-
67
-
68
-
69
-
70
-
71
-
72
-
73
-
74
-
75
-
76
-
77
-
78
-
79
-
80
-
81
-
82
-
83
-
84
-
85
-
86
-
87
-
88
-
89
-
90
-
91
-
92
-
93
-
94
-
95
-
96
-
97
-
98
-
99
-
100
-
101
-
102
-
103
-
104
-
105
-
106
-
107
-
108
-
109
-
110
-
111
-
112
-
113
-
114
-
115
-
116
 |
 |
51
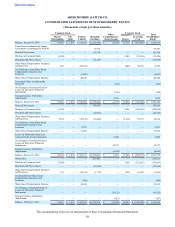
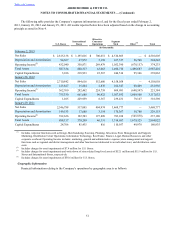
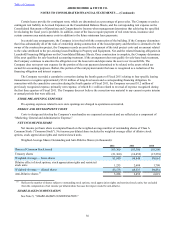
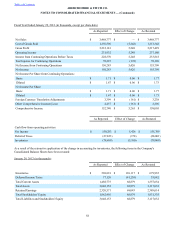
The following table provides the Company’s segment information as of, and for the fiscal years ended February 2,
2013, January 28, 2012 and January 29, 2011. All results reported below have been adjusted based on the change in accounting
principle as noted in Note 4.
U.S. Stores International
Stores
Direct-to-
Consumer
Operations Segment
Total Other(1) Total
(in thousands):
February 2, 2013
Net Sales $ 2,615,138 $ 1,195,016 $ 700,651 $ 4,510,805 — $ 4,510,805
Depreciation and Amortization 94,367 67,972 5,198 167,537 56,708 224,245
Operating Income(2) 432,040 350,871 269,479 1,052,390 (678,157) 374,233
Total Assets 587,334 840,317 63,063 1,490,714 1,496,687 2,987,401
Capital Expenditures 3,016 218,933 22,567 244,516 95,346 339,862
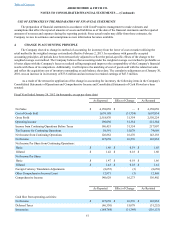
January 28, 2012
Net Sales 2,710,842 894,616 552,600 4,158,058 — 4,158,058
Depreciation and Amortization 125,827 35,844 2,876 164,547 68,409 232,956
Operating Income(3) 362,760 282,462 224,759 869,981 (648,597) 221,384
Total Assets 755,330 661,680 90,922 1,507,932 1,609,100 3,117,032
Capital Expenditures 1,105 229,959 8,367 239,431 79,167 318,598
January 29, 2011
Net Sales 2,546,798 517,005 404,974 3,468,777 — 3,468,777
Depreciation and Amortization 149,533 17,680 3,154 170,367 58,786 229,153
Operating Income(4) 392,626 192,583 197,809 783,018 (545,838) 237,180
Total Assets 898,157 370,209 46,331 1,314,697 1,679,325 2,994,022
Capital Expenditures 24,706 85,435 816 110,957 49,978 160,935
(1) Includes corporate functions such as Design, Merchandising, Sourcing, Planning, Allocation, Store Management and Support,
Marketing, Distribution Center Operations, Information Technology, Real Estate, Finance, Legal, Human Resources and other
corporate overhead. Operating Income includes: marketing, general and administrative expense; store management and support
functions such as regional and district management and other functions not dedicated to an individual store; and distribution center
costs.
(2) Includes charges for asset impairments of $7.4 million for U.S. Stores.
(3) Includes charges for asset impairments and write-down of store-related long-lived assets of $52.1 million and $15.9 million for U.S.
Stores and International Stores, respectively.
(4) Includes charges for asset impairments of $50.6 million for U.S. Stores.
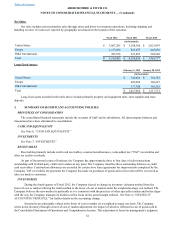
Geographic Information
Financial information relating to the Company’s operations by geographic area is as follows:
Table of Contents ABERCROMBIE & FITCH CO.
NOTES TO CONSOLIDATED FINANCIAL STATEMENTS — (Continued)