AT&T Wireless 2013 Annual Report Download - page 73
Download and view the complete annual report
Please find page 73 of the 2013 AT&T Wireless annual report below. You can navigate through the pages in the report by either clicking on the pages listed below, or by using the keyword search tool below to find specific information within the annual report.-
 1
1 -
2
-
3
-
4
-
5
-
6
-
7
-
8
-
9
-
10
-
11
-
12
-
13
-
14
-
15
-
16
-
17
-
18
-
19
-
20
-
21
-
22
-
23
-
24
-
25
-
26
-
27
-
28
-
29
-
30
-
31
-
32
-
33
-
34
-
35
-
36
-
37
-
38
-
39
-
40
-
41
-
42
-
43
-
44
-
45
-
46
-
47
-
48
-
49
-
50
-
51
-
52
-
53
-
54
-
55
-
56
-
57
-
58
-
59
-
60
-
61
-
62
-
 63
63 -
 64
64 -
 65
65 -
 66
66 -
 67
67 -
 68
68 -
 69
69 -
 70
70 -
 71
71 -
 72
72 -
 73
73 -
 74
74 -
 75
75 -
 76
76 -
 77
77 -
 78
78 -
 79
79 -
 80
80
 |
 |

AT&T Inc. | 71
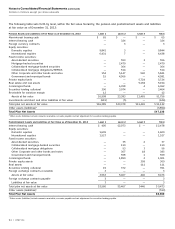
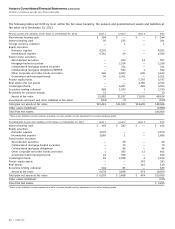
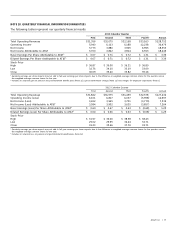
NOTE 18. QUARTERLY FINANCIAL INFORMATION (UNAUDITED)
The following tables represent our quarterly financial results:
2013 Calendar Quarter
First Second Third Fourth2 Annual
Total Operating Revenues $31,356 $32,075 $32,158 $33,163 $128,752
Operating Income 5,940 6,113 6,188 12,238 30,479
Net Income 3,773 3,880 3,905 6,995 18,553
Net Income Attributable to AT&T 3,700 3,822 3,814 6,913 18,249
Basic Earnings Per Share Attributable to AT&T1 $ 0.67 $ 0.71 $ 0.72 $ 1.31 $ 3.39
Diluted Earnings Per Share Attributable to AT&T1 $ 0.67 $ 0.71 $ 0.72 $ 1.31 $ 3.39
Stock Price
High $ 36.87 $ 39.00 $ 36.31 $ 36.80
Low 32.76 34.10 33.19 33.09
Close 36.69 35.40 33.82 35.16
1 Quarterly earnings per share impacts may not add to full-year earnings per share impacts due to the difference in weighted-average common shares for the quarters versus
the weighted-average common shares for the year.
2 Includes an actuarial gain on pension and postretirement benefit plans (Note 12), special termination charges (Note 12) and charges for employee separations (Note 1).
2012 Calendar Quarter
First Second Third Fourth2 Annual
Total Operating Revenues $31,822 $31,575 $31,459 $32,578 $127,434
Operating Income (Loss) 6,101 6,817 6,037 (5,958) 12,997
Net Income (Loss) 3,652 3,965 3,701 (3,779) 7,539
Net Income (Loss) Attributable to AT&T 3,584 3,902 3,635 (3,857) 7,264
Basic Earnings (Loss) Per Share Attributable to AT&T1 $ 0.60 $ 0.67 $ 0.63 $ (0.68) $ 1.25
Diluted Earnings (Loss) Per Share Attributable to AT&T1 $ 0.60 $ 0.66 $ 0.63 $ (0.68) $ 1.25
Stock Price
High $ 31.97 $ 36.00 $ 38.58 $ 38.43
Low 29.02 29.95 34.24 32.71
Close 31.23 35.66 37.70 33.71
1 Quarterly earnings per share impacts may not add to full-year earnings per share impacts due to the difference in weighted-average common shares for the quarters versus
the weighted-average common shares for the year.
2 Includes an actuarial loss on pension and postretirement benefit plans (Note 12).