AT&T Wireless 2013 Annual Report Download - page 62
Download and view the complete annual report
Please find page 62 of the 2013 AT&T Wireless annual report below. You can navigate through the pages in the report by either clicking on the pages listed below, or by using the keyword search tool below to find specific information within the annual report.-
 1
1 -
2
-
3
-
4
-
5
-
6
-
7
-
8
-
9
-
10
-
11
-
12
-
13
-
14
-
15
-
16
-
17
-
18
-
19
-
20
-
21
-
22
-
23
-
24
-
25
-
26
-
27
-
28
-
29
-
30
-
31
-
32
-
33
-
34
-
35
-
36
-
37
-
38
-
39
-
40
-
41
-
42
-
43
-
44
-
45
-
46
-
47
-
48
-
49
-
50
-
51
-
 52
52 -
 53
53 -
 54
54 -
 55
55 -
 56
56 -
 57
57 -
 58
58 -
 59
59 -
 60
60 -
 61
61 -
 62
62 -
 63
63 -
 64
64 -
 65
65 -
 66
66 -
 67
67 -
 68
68 -
 69
69 -
 70
70 -
 71
71 -
 72
72 -
73
-
74
-
75
-
76
-
77
-
78
-
79
-
80
 |
 |

Notes to Consolidated Financial Statements (continued)
Dollars in millions except per share amounts
60 | AT&T Inc.
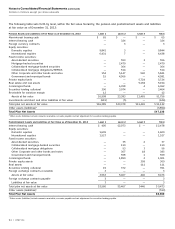
Net Periodic Benefit Cost and Other Amounts Recognized in Other Comprehensive Income
Periodic Benefit Costs
Our combined net pension and postretirement (credit) cost recognized in our consolidated statements of income was
$(7,390), $10,257 and $7,288 for the years ended December 31, 2013, 2012 and 2011. A portion of pension and
postretirement benefit costs is capitalized as part of the benefit load on internal construction and capital expenditures,
providing a small reduction in the net expense recorded. The following table presents the components of net periodic
benefit cost.
Pension Benefits Postretirement Benefits
2013 2012 2011 2013 2012 2011
Service cost – benefits earned during the period $ 1,321 $ 1,216 $ 1,186 $ 352 $ 336 $ 362
Interest cost on projected benefit obligation 2,429 2,800 2,958 1,532 1,725 2,051
Expected return on assets (3,312) (3,520) (3,690) (706) (811) (1,040)
Amortization of prior service credit (94) (15) (15) (1,161) (927) (694)
Actuarial (gain) loss (5,013) 5,206 4,498 (2,738) 4,247 1,672
Net pension and postretirement (credit) cost $(4,669) $ 5,687 $ 4,937 $(2,721) $4,570 $ 2,351
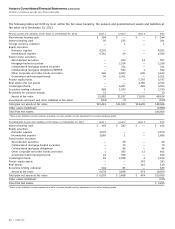
Other Changes in Benefit Obligations Recognized in Other Comprehensive Income
The following table presents the after-tax changes in benefit obligations recognized in OCI and the after-tax prior service
credits that were amortized from OCI into net periodic benefit costs:
Pension Benefits Postretirement Benefits
2013 2012 2011 2013 2012 2011
Balance at beginning of year $641 $ 92 $102 $4,766 $3,655 $2,951
Prior service (cost) credit — 559 — 2,765 1,686 1,134
Amortization of prior service credit (58) (10) (10) (719) (575) (430)
Total recognized in other comprehensive (income) loss (58) 549 (10) 2,046 1,111 704
Balance at end of year $583 $641 $ 92 $6,812 $4,766 $3,655
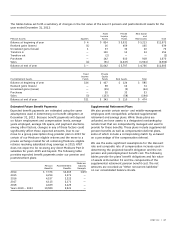
The accumulated benefit obligation for our pension plans
represents the actuarial present value of benefits based
on employee service and compensation as of a certain
date and does not include an assumption about future
compensation levels. The accumulated benefit obligation
for our pension plans was $55,077 at December 31, 2013,
and $57,010 at December 31, 2012.
Amounts recognized on our consolidated balance sheets at
December 31 are listed below:
Pension Benefits Postretirement Benefits
2013 2012 2013 2012
Current portion of
employee benefit
obligation1 $ — $ — $ (1,949) $ (2,116)
Employee benefit
obligation2 (9,322) (13,851) (19,376) (26,020)
Net amount
recognized $(9,322) $(13,851) $(21,325) $(28,136)
1 Included in “Accounts payable and accrued liabilities.”
2 Included in “Postemployment benefit obligation.”