AT&T Wireless 2013 Annual Report Download - page 22
Download and view the complete annual report
Please find page 22 of the 2013 AT&T Wireless annual report below. You can navigate through the pages in the report by either clicking on the pages listed below, or by using the keyword search tool below to find specific information within the annual report.-
 1
1 -
2
-
3
-
4
-
5
-
6
-
7
-
8
-
9
-
10
-
11
-
 12
12 -
 13
13 -
 14
14 -
 15
15 -
 16
16 -
 17
17 -
 18
18 -
 19
19 -
 20
20 -
 21
21 -
 22
22 -
 23
23 -
 24
24 -
 25
25 -
 26
26 -
 27
27 -
 28
28 -
 29
29 -
 30
30 -
 31
31 -
 32
32 -
33
-
34
-
35
-
36
-
37
-
38
-
39
-
40
-
41
-
42
-
43
-
44
-
45
-
46
-
47
-
48
-
49
-
50
-
51
-
52
-
53
-
54
-
55
-
56
-
57
-
58
-
59
-
60
-
61
-
62
-
63
-
64
-
65
-
66
-
67
-
68
-
69
-
70
-
71
-
72
-
73
-
74
-
75
-
76
-
77
-
78
-
79
-
80
 |
 |

Management’s Discussion and Analysis of Financial Condition and Results of Operations (continued)
Dollars in millions except per share amounts
20 | AT&T Inc.
OPERATING ENVIRONMENT AND TRENDS OF THE BUSINESS
2014 Revenue Trends We expect our operating
environment in 2014 to remain challenging as current
uncertain economic conditions continue and competition
continues to increase, especially in the wireless area.
Despite these challenges, we expect our consolidated
operating revenues in 2014 to grow, driven by continuing
growth in our wireless data and IP-related wireline data
services, including U-verse. We expect our primary driver
of growth to be wireless data services from smartphones,
tablets and other services (such as wireless home services
and mobile navigation, including car-based services).
While price changes may impact revenue and service
ARPU, we expect to increase equipment sales under our
AT&T Next installment program. We expect that all our
major customer categories will continue to increase their
use of Internet-based broadband/data services. We expect
continuing declines in traditional access lines and in
traditional telephone service revenues. Where available,
our U-verse services have proved effective in stemming
access line losses, and we expect to continue to expand
our U-verse service offerings in 2014.
2014 Expense Trends We expect a stable consolidated
operating income margin in 2014 with expanding wireless
margins being offset by wireline margin pressure as a
result of our IP broadband and video expansion and other
initiatives to enhance business offerings, including cloud
services. Expenses related to growth areas of our business,
including wireless data, U-verse and strategic business
services, will apply some pressure to our operating
income margin.
Market Conditions During 2013, ongoing slow recovery
in the general economy has continued to negatively affect
our customers. Our business and residential customers have
continued to purchase lower levels of traditional wireline
services and we expect those trends to continue. These
negative trends were partially offset by continued growth
in our wireless data and IP-related services. We expect
further pressure on pricing and margins as we compete
for both wireline and wireless customers who have less
discretionary income. We also may experience difficulty
purchasing equipment in a timely manner or maintaining
and replacing equipment under warranty from our suppliers.
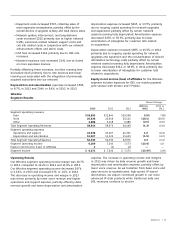
Other
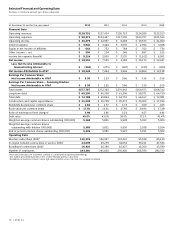
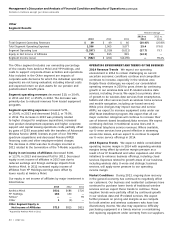
Segment Results
Percent Change
2013 vs. 2012 vs.
2013 2012 2011 2012 2011
Total Segment Operating Revenues $ 39 $ 49 $ 66 (20.4)% (25.8)%
Total Segment Operating Expenses 1,336 1,065 5,077 25.4 (79.0)
Segment Operating Loss (1,297) (1,016) (5,011) (27.7) 79.7
Equity in Net Income of Affiliates 715 815 815 (12.3) —
Segment Income (Loss) $ (582) $ (201) $(4,196) — 95.2%
The Other segment includes our ownership percentage
of the results from América Móvil and YP Holdings, and
costs to support corporate-driven activities and operations.
Also included in the Other segment are impacts of
corporate-wide decisions for which the individual operating
segments are not being evaluated, including interest costs
and expected return on plan assets for our pension and
postretirement benefit plans.
Segment operating revenues decreased $10, or 20.4%,
in 2013 and $17, or 25.8%, in 2012. The decrease was
primarily due to reduced revenues from leased equipment
programs.
Segment operating expenses increased $271,
or 25.4%, in 2013 and decreased $4,012, or 79.0%,
in 2012. The increase in 2013 was primarily related
to higher charges for employee separations, increased
new product development expenses and higher corporate
support and capital leasing operations costs, partially offset
by gains of $293 associated with the transfers of Advanced
Wireless Service (AWS) licenses as part of our 700 MHz
spectrum acquisitions and decreased Pension/OPEB
financing costs and other employee-related charges.
The decrease in 2012 was due to charges incurred in
2011 related to the termination of the T-Mobile acquisition.
Equity in net income of affiliates decreased $100,
or 12.3%, in 2013 and remained flat for 2012. Decreased
equity in net income of affiliates in 2013 was due to
reduced earnings and foreign exchange impacts from
América Móvil. In 2012 increased equity income of
affiliates from YP Holdings earnings were offset by
lower results at América Móvil.
Our equity in net income of affiliates by major investment is
listed below:
2013 2012 2011
América Móvil $532 $686 $720
YP Holdings 182 130 —
Telmex1 — — 95
Other 1 (1) —
Other Segment Equity in
Net Income of Affiliates $715 $815 $815
1 Acquired by América Móvil in 2011.