AT&T Wireless 2013 Annual Report Download - page 15
Download and view the complete annual report
Please find page 15 of the 2013 AT&T Wireless annual report below. You can navigate through the pages in the report by either clicking on the pages listed below, or by using the keyword search tool below to find specific information within the annual report.-
 1
1 -
2
-
3
-
4
-
 5
5 -
 6
6 -
 7
7 -
 8
8 -
 9
9 -
 10
10 -
 11
11 -
 12
12 -
 13
13 -
 14
14 -
 15
15 -
 16
16 -
 17
17 -
 18
18 -
 19
19 -
 20
20 -
 21
21 -
 22
22 -
 23
23 -
 24
24 -
 25
25 -
26
-
27
-
28
-
29
-
30
-
31
-
32
-
33
-
34
-
35
-
36
-
37
-
38
-
39
-
40
-
41
-
42
-
43
-
44
-
45
-
46
-
47
-
48
-
49
-
50
-
51
-
52
-
53
-
54
-
55
-
56
-
57
-
58
-
59
-
60
-
61
-
62
-
63
-
64
-
65
-
66
-
67
-
68
-
69
-
70
-
71
-
72
-
73
-
74
-
75
-
76
-
77
-
78
-
79
-
80
 |
 |

AT&T Inc. | 13
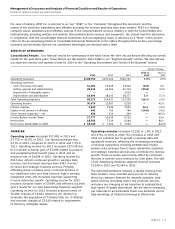
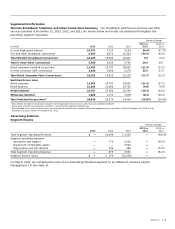
The former Advertising Solutions segment (sold on
May8,2012), included our directory operations, which
published Yellow and White Pages directories and sold
directory advertising, Internet-based advertising and
local search.
The Other segment accounted for less than 1% of our
2013 and 2012 total segment operating revenues. Since
segment operating expenses exceeded revenue in both
years, a segment loss was incurred in both 2013 and 2012.
This segment includes results from our equity investments
in América Móvil and YP Holdings, and costs to support
corporate-driven activities and operations. Also included
in the Other segment are impacts of corporate-wide
decisions for which the individual operating segments are
not being evaluated, including interest costs and expected
return on plan assets for our pension and postretirement
benefit plans.
The following sections discuss our operating results by
segment. Operations and support expenses include certain
network planning and engineering expenses; information
technology; our repair technicians and repair services;
property taxes; bad debt expense; advertising costs;
sales and marketing functions, including customer
service centers; real estate costs, including maintenance
and utilities on all buildings; credit and collection functions;
and corporate support costs, such as finance, legal, human
resources and external affairs. Pension and postretirement
service costs, net of amounts capitalized as part of
construction labor, are also included to the extent that
they are associated with employees who perform these
functions.
We discuss capital expenditures for each segment in
“Liquidity and Capital Resources.”
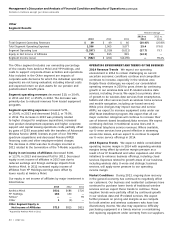
Segment Results
Our segments are strategic business units that offer
different products and services over various technology
platforms and are managed accordingly. Our operating
segment results presented in Note 4 and discussed
below for each segment follow our internal management
reporting. We analyze our operating segments based on
segment income before income taxes. We make our
capital allocation decisions based on the strategic needs
of the business, needs of the network (wireless or wireline)
providing services and demands to provide emerging
services to our customers. Actuarial gains and losses
from pension and other postemployment benefits, interest
expense and other income (expense) – net, are managed
only on a total company basis and are, accordingly,
reflected only in consolidated results. Therefore, these
items are not included in each segment’s percentage of
our total segment income. Each segment’s percentage
of total segment operating revenue and income calculations
is derived from our segment results, and income percentage
may total more than 100 percent due to losses in one or
more segments. We have three reportable segments:
(1)Wireless, (2) Wireline and (3) Other. Our operating
results prior to May 9, 2012, also included our sold
Advertising Solutions segment (see Note 5).
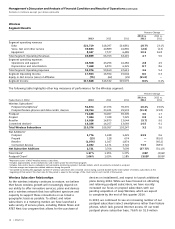
The Wireless segment accounted for approximately 54%
of our 2013 total segment operating revenues as compared
to 52% in 2012 and 76% of our 2013 total segment income
as compared to 70% in 2012. This segment uses our
nationwide network to provide consumer and business
customers with wireless data and voice communications
services. This segment includes our portion of the results
from our mobile payment joint venture ISIS, which is
accounted for as an equity method investment.
The Wireline segment accounted for approximately 46%
of our 2013 total segment operating revenues as compared
to 47% in 2012 and 27% of our 2013 total segment
income as compared to 31% in 2012. This segment uses
our regional, national and global network to provide
consumer and business customers with data and voice
communications services, U-verse high-speed broadband,
video, voice services and managed networking to business
customers.