AT&T Wireless 2013 Annual Report Download - page 56
Download and view the complete annual report
Please find page 56 of the 2013 AT&T Wireless annual report below. You can navigate through the pages in the report by either clicking on the pages listed below, or by using the keyword search tool below to find specific information within the annual report.-
 1
1 -
2
-
3
-
4
-
5
-
6
-
7
-
8
-
9
-
10
-
11
-
12
-
13
-
14
-
15
-
16
-
17
-
18
-
19
-
20
-
21
-
22
-
23
-
24
-
25
-
26
-
27
-
28
-
29
-
30
-
31
-
32
-
33
-
34
-
35
-
36
-
37
-
38
-
39
-
40
-
41
-
42
-
43
-
44
-
45
-
 46
46 -
 47
47 -
 48
48 -
 49
49 -
 50
50 -
 51
51 -
 52
52 -
 53
53 -
 54
54 -
 55
55 -
 56
56 -
 57
57 -
 58
58 -
 59
59 -
 60
60 -
 61
61 -
 62
62 -
 63
63 -
 64
64 -
 65
65 -
 66
66 -
67
-
68
-
69
-
70
-
71
-
72
-
73
-
74
-
75
-
76
-
77
-
78
-
79
-
80
 |
 |

Notes to Consolidated Financial Statements (continued)
Dollars in millions except per share amounts
54 | AT&T Inc.
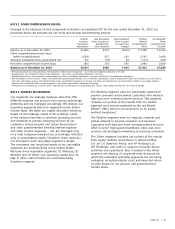
applicable, a Co-Borrower, reduce to $0 the commitments
of the lenders, or (ii) certain events of default occur.
We and lenders representing more than 50% of the
facility amount may agree to extend their commitments
for two one-year periods beyond the December 11, 2017,
termination date, under certain circumstances. We also can
request the lenders to further increase their commitments
(i.e., raise the available credit) up to an additional $2,000
provided no event of default has occurred. The same
provisions apply to the December 2018 Facility except
that the applicable date is December 11, 2018.
• We fail to make certain minimum funding payments
under ERISA.
• Our bankruptcy or insolvency.
Both agreements permit subsidiaries to be added as
additional borrowers, with or without a guarantee by
AT&T. The terms of the guarantee are set forth in the
agreements.
The obligations of the lenders under the December 2017
Facility to provide advances will terminate on December
11, 2017, unless prior to that date either: (i) AT&T, and if
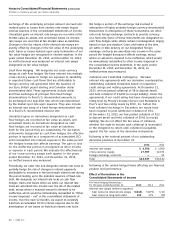
NOTE 10. FAIR VALUE MEASUREMENTS AND DISCLOSURE
The Fair Value Measurement and Disclosure framework provides a three-tiered fair value hierarchy that gives highest priority
to unadjusted quoted prices in active markets for identical assets or liabilities (Level 1 measurements) and the lowest
priority to unobservable inputs (Level 3 measurements). The three levels of the fair value hierarchy are described below:
LEVEL 1 Inputs to the valuation methodology are unadjusted quoted prices for identical assets or liabilities in active
markets that we have the ability to access.
LEVEL 2 Inputs to the valuation methodology include:
• Quoted prices for similar assets and liabilities in active markets.
• Quoted prices for identical or similar assets or liabilities in inactive markets.
• Inputs other than quoted market prices that are observable for the asset or liability.
• Inputs that are derived principally from or corroborated by observable market data by correlation or
other means.
LEVEL 3 Inputs to the valuation methodology are unobservable and significant to the fair value measurement.
• Fair value is often based on developed models in which there are few, if any, external observations.
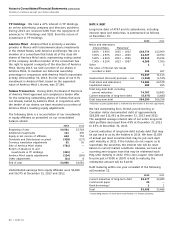
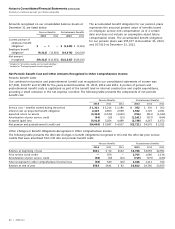
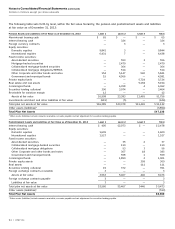
Long-Term Debt and Other Financial Instruments
The carrying amounts and estimated fair values of our
long-term debt, including current maturities and other
financial instruments, are summarized as follows:
December 31, 2013 December 31, 2012
Carrying Fair Carrying Fair
Amount Value Amount Value
Notes and debentures $74,484 $79,309 $69,578 $81,310
Commercial paper 20 20 — —
Bank borrowings 1 1 1 1
Investment securities 2,450 2,450 2,218 2,218
The carrying value of debt with an original maturity of
less than one year approximates market value. The fair
value measurements used for notes and debentures are
considered Level 2 and are determined using various
methods, including quoted prices for identical or similar
securities in both active and inactive markets.
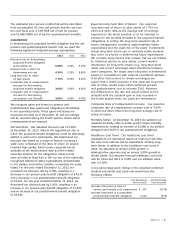
The fair value measurements level of an asset or liability
within the fair value hierarchy is based on the lowest
level of any input that is significant to the fair value
measurement. Valuation techniques used should maximize
the use of observable inputs and minimize the use of
unobservable inputs.
The valuation methodologies described above may
produce a fair value calculation that may not be indicative
of future net realizable value or reflective of future fair
values. We believe our valuation methods are appropriate
and consistent with other market participants. The use of
different methodologies or assumptions to determine the
fair value of certain financial instruments could result in
a different fair value measurement at the reporting date.
There have been no changes in the methodologies used
since December 31, 2012.