AT&T Wireless 2013 Annual Report Download - page 20
Download and view the complete annual report
Please find page 20 of the 2013 AT&T Wireless annual report below. You can navigate through the pages in the report by either clicking on the pages listed below, or by using the keyword search tool below to find specific information within the annual report.-
 1
1 -
2
-
3
-
4
-
5
-
6
-
7
-
8
-
9
-
 10
10 -
 11
11 -
 12
12 -
 13
13 -
 14
14 -
 15
15 -
 16
16 -
 17
17 -
 18
18 -
 19
19 -
 20
20 -
 21
21 -
 22
22 -
 23
23 -
 24
24 -
 25
25 -
 26
26 -
 27
27 -
 28
28 -
 29
29 -
 30
30 -
31
-
32
-
33
-
34
-
35
-
36
-
37
-
38
-
39
-
40
-
41
-
42
-
43
-
44
-
45
-
46
-
47
-
48
-
49
-
50
-
51
-
52
-
53
-
54
-
55
-
56
-
57
-
58
-
59
-
60
-
61
-
62
-
63
-
64
-
65
-
66
-
67
-
68
-
69
-
70
-
71
-
72
-
73
-
74
-
75
-
76
-
77
-
78
-
79
-
80
 |
 |

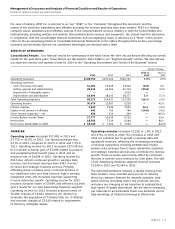
Management’s Discussion and Analysis of Financial Condition and Results of Operations (continued)
Dollars in millions except per share amounts
18 | AT&T Inc.
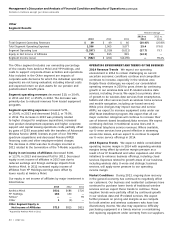
• Local voice revenues decreased $1,420, or 10.2%,
in 2013 and $1,526, or 9.9%, in 2012. The decrease
in 2013 and 2012 was driven primarily by a 15.8%
and 14.0% decline in switched access lines.
• Long-distance revenues decreased $843, or 11.0%,
in 2013 and $965, or 11.2%, in 2012. Lower demand
for long-distance service from our business and
consumer customers decreased revenues $709
in 2013 and $801 in 2012. Additionally, expected
declines in the number of national mass-market
customers decreased revenues $135 in 2013 and
$162 in 2012.
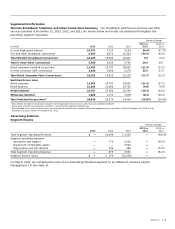
Other operating revenues decreased $230, or 4.5%,
in 2013 and $362, or 6.6%, in 2012. Major items included
in other operating revenues are integration services and
customer premises equipment, government-related services
and outsourcing, which account for approximately 60%
of total other revenue in the years reported.
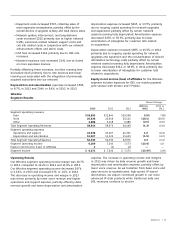
Operations and support expenses increased $431,
or 1.0%, in 2013 and decreased $154, or 0.4%, in 2012.
Operations and support expenses consist of costs incurred
to provide our products and services, including costs of
operating and maintaining our networks and personnel
costs, such as compensation and benefits.
The 2013 increase was primarily due to increased cost of
sales of $680, primarily related to U-verse related expenses,
advertising expenses of $155 and contract services of
$125. These increases were partially offset by lower
employee-related expense of $437, reflecting workforce
reduction initiatives, and USF fees of $116, which were
offset by lower USF revenue.
The 2012 decrease was primarily due to lower employee-
related expense of $470, reflecting workforce reduction
initiatives, decreased traffic compensation expense of
$281 and lower nonemployee-related expense of $172.
These decreases were partially offset by increased cost
of sales of $538, primarily related to U-verse related
expenses, and increased USF fees of $254, which were
offset by higher USF revenue.
Depreciation and amortization expenses decreased
$216, or 1.9%, in 2013 and $492, or 4.2%, in 2012.
Both decreases were primarily related to lower amortization
of intangibles for customer lists associated with
acquisitions.
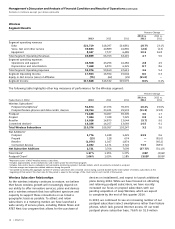
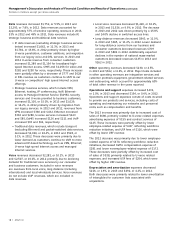
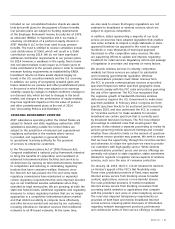
Data revenues increased $1,752, or 5.5%, in 2013 and
$2,293, or 7.8%, in 2012. Data revenues accounted for
approximately 57% of wireline operating revenues in 2013,
53% in 2012 and 49% in 2011. Data revenues include IP,
strategic business and traditional data services.
• IP data revenues (excluding strategic business services
below) increased $1,662, or 11.3%, in 2013 and
$1,781, or 13.8%, in 2012 primarily driven by higher
U-verse penetration, customer additions, and migration
from our legacy voice and DSL services. In 2013 and
2012 U-verse revenue from consumer customers
increased $1,289 and $1,154 for broadband high-
speed Internet access, $995 and $1,056 for video and
$282 and $250 for voice, respectively. These increases
were partially offset by a decrease of $777 and $628
in DSL revenue as customers continue to shift to our
U-verse or competitors’ high speed Internet access
offerings.
• Strategic business services, which include VPN,
Ethernet, hosting, IP conferencing, VoIP, Ethernet-
access to Managed Internet Service (EaMIS), security
services and U-verse provided to business customers,
increased $1,105, or 15.0%, in 2013 and $1,029,
or 16.2%, in 2012 primarily driven by migration from
our legacy services. In 2013 and 2012, revenues from
VPN increased $360 and $432, Ethernet increased
$310 and $280, U-verse services increased $143
and $85, EaMIS increased $126 and $111 and VoIP
increased $93 and $61, respectively.
• Traditional data revenues, which include transport
(excluding Ethernet) and packet-switched data services,
decreased $1,016, or 10.4%, in 2013 and $528, or
5.1%, in 2012. These decreases were primarily due to
lower demand as customers continue to shift to more
advanced IP-based technology such as VPN, Ethernet,
U-verse high speed Internet access and managed
Internet services.
Voice revenues decreased $2,281, or 10.1%, in 2013
and $2,507, or 10.0%, in 2012 primarily due to declining
demand for traditional voice services by our consumer
and business customers. Included in voice revenues
are revenues from local voice, long distance (including
international) and local wholesale services. Voice revenues
do not include VoIP revenues, which are included in
data revenues.