AT&T Wireless 2013 Annual Report Download - page 64
Download and view the complete annual report
Please find page 64 of the 2013 AT&T Wireless annual report below. You can navigate through the pages in the report by either clicking on the pages listed below, or by using the keyword search tool below to find specific information within the annual report.-
 1
1 -
2
-
3
-
4
-
5
-
6
-
7
-
8
-
9
-
10
-
11
-
12
-
13
-
14
-
15
-
16
-
17
-
18
-
19
-
20
-
21
-
22
-
23
-
24
-
25
-
26
-
27
-
28
-
29
-
30
-
31
-
32
-
33
-
34
-
35
-
36
-
37
-
38
-
39
-
40
-
41
-
42
-
43
-
44
-
45
-
46
-
47
-
48
-
49
-
50
-
51
-
52
-
53
-
 54
54 -
 55
55 -
 56
56 -
 57
57 -
 58
58 -
 59
59 -
 60
60 -
 61
61 -
 62
62 -
 63
63 -
 64
64 -
 65
65 -
 66
66 -
 67
67 -
 68
68 -
 69
69 -
 70
70 -
 71
71 -
 72
72 -
 73
73 -
 74
74 -
75
-
76
-
77
-
78
-
79
-
80
 |
 |

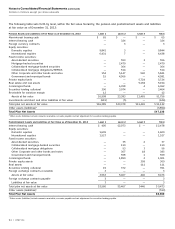
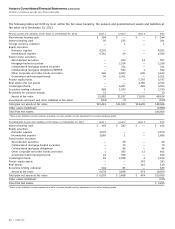
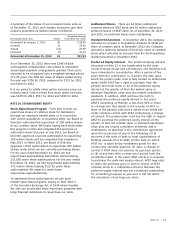
Notes to Consolidated Financial Statements (continued)
Dollars in millions except per share amounts
62 | AT&T Inc.
future economic scenarios, to maximize long-term
investment return with an acceptable level of risk based
on our pension and postretirement obligations, and to
be broadly diversified across and within the capital
markets to insulate asset values against adverse
experience in any one market. Each asset class has
broadly diversified characteristics. Substantial biases
toward any particular investing style or type of security
are sought to be avoided by managing the aggregation
of all accounts with portfolio benchmarks. Asset and
benefit obligation forecasting studies are conducted
periodically, generally every two to three years, or when
significant changes have occurred in market conditions,
benefits, participant demographics or funded status.
Decisions regarding investment policy are made with
an understanding of the effect of asset allocation on
funded status, future contributions and projected
expenses. The current asset allocation policy and risk
level for the pension plan and VEBA assets is based
on a study completed and approved during 2013 and
is reflected in the table below.
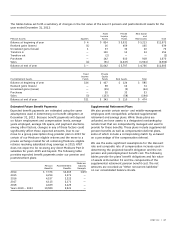
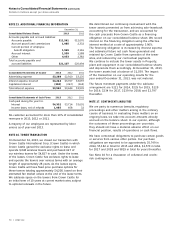
Plan Assets
Plan assets consist primarily of private and public equity,
government and corporate bonds, and real assets (real
estate and natural resources). The asset allocations of the
pension plans are maintained to meet ERISA requirements.
Any plan contributions, as determined by ERISA regulations,
are made to a pension trust for the benefit of plan
participants. As part of our voluntary contribution of the
Mobility preferred equity interest, we will contribute $560
of cash distributions during 2014. We do not have
additional significant required contributions to our pension
plans for 2014.
We maintain VEBA trusts to partially fund postretirement
benefits; however, there are no ERISA or regulatory
requirements that these postretirement benefit plans be
funded annually.
The principal investment objectives are to ensure the
availability of funds to pay pension and postretirement
benefits as they become due under a broad range of
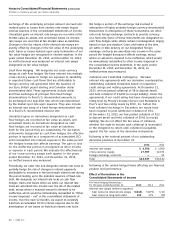
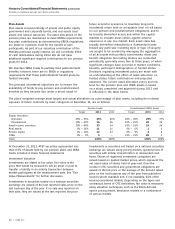
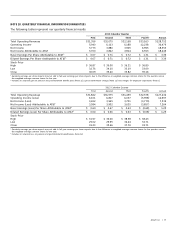
The plans’ weighted-average asset targets and actual allocations as a percentage of plan assets, including the notional
exposure of future contracts by asset categories at December 31, are as follows:
Pension Assets Postretirement (VEBA) Assets
Target 2013 2012 Target 2013 2012
Equity securities:
Domestic 25% – 35% 25% 26% 20% – 30% 25% 37%
International 10% – 20% 16 16 15% – 25% 20 33
Fixed income securities 30% – 40% 33 34 19% – 29% 24 24
Real assets 6% – 16% 11 11 0% – 6% 1 1
Private equity 4% – 14% 12 13 0% – 9% 4 4
Other 0% – 5% 3 — 21% – 31% 26 1
Total 100% 100% 100% 100%
Investments in securities not traded on a national securities
exchange are valued using pricing models, quoted prices of
securities with similar characteristics or discounted cash
flows. Shares of registered investment companies are
valued based on quoted market prices, which represent the
net asset value of shares held at year-end. Over-the-
counter (OTC) securities and government obligations are
valued at the bid price or the average of the bid and asked
price on the last business day of the year from published
sources where available and, if not available, from other
sources considered reliable. Depending on the types and
contractual terms of OTC derivatives, fair value is measured
using valuation techniques, such as the Black-Scholes
option pricing model, simulation models or a combination
of various models.
At December 31, 2013, AT&T securities represented less
than 0.5% of assets held by our pension plans and VEBA
trusts included in these financial statements.
Investment Valuation
Investments are stated at fair value. Fair value is the
price that would be received to sell an asset or paid to
transfer a liability in an orderly transaction between
market participants at the measurement date. See “Fair
Value Measurements” for further discussion.
Investments in securities traded on a national securities
exchange are valued at the last reported sales price on the
last business day of the year. If no sale was reported on
that date, they are valued at the last reported bid price.