AT&T Wireless 2013 Annual Report Download - page 67
Download and view the complete annual report
Please find page 67 of the 2013 AT&T Wireless annual report below. You can navigate through the pages in the report by either clicking on the pages listed below, or by using the keyword search tool below to find specific information within the annual report.-
 1
1 -
2
-
3
-
4
-
5
-
6
-
7
-
8
-
9
-
10
-
11
-
12
-
13
-
14
-
15
-
16
-
17
-
18
-
19
-
20
-
21
-
22
-
23
-
24
-
25
-
26
-
27
-
28
-
29
-
30
-
31
-
32
-
33
-
34
-
35
-
36
-
37
-
38
-
39
-
40
-
41
-
42
-
43
-
44
-
45
-
46
-
47
-
48
-
49
-
50
-
51
-
52
-
53
-
54
-
55
-
56
-
 57
57 -
 58
58 -
 59
59 -
 60
60 -
 61
61 -
 62
62 -
 63
63 -
 64
64 -
 65
65 -
 66
66 -
 67
67 -
 68
68 -
 69
69 -
 70
70 -
 71
71 -
 72
72 -
 73
73 -
 74
74 -
 75
75 -
 76
76 -
 77
77 -
78
-
79
-
80
 |
 |

AT&T Inc. | 65
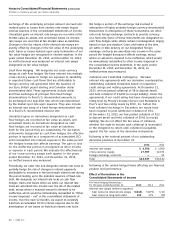
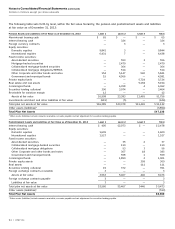
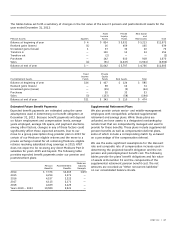
The tables below set forth a summary of changes in the fair value of the Level 3 pension and postretirement assets for the
year ended December 31, 2013:
Fixed Private Real Estate
Income Equity and
Pension Assets Equities Funds Funds Real Assets Total
Balance at beginning of year $ — $1,042 $ 5,797 $ 4,766 $ 11,605
Realized gains (losses) (3) 53 390 122 562
Unrealized gains (losses) 3 (8) 546 525 1,066
Transfers in — 5 — — 5
Transfers out — (442) — — (442)
Purchases — 75 1,214 354 1,643
Sales — (178) (2,223) (573) (2,974)
Balance at end of year $ — $ 547 $5,724 $5,194 $11,465
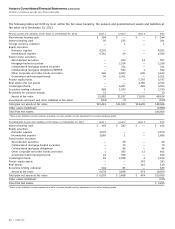
Fixed Private
Income Equity
Postretirement Assets Funds Funds Real Assets Total
Balance at beginning of year $21 $ 343 $ 110 $ 474
Realized gains (losses) — 2 12 14
Unrealized gains (losses) 1 58 4 63
Transfers in 1 — — 1
Transfers out (1) — — (1)
Purchases 5 89 27 121
Sales (1) (183) (42) (226)
Balance at end of year $26 $ 309 $ 111 $ 446