AT&T Wireless 2013 Annual Report Download - page 13
Download and view the complete annual report
Please find page 13 of the 2013 AT&T Wireless annual report below. You can navigate through the pages in the report by either clicking on the pages listed below, or by using the keyword search tool below to find specific information within the annual report.-
 1
1 -
2
-
 3
3 -
 4
4 -
 5
5 -
 6
6 -
 7
7 -
 8
8 -
 9
9 -
 10
10 -
 11
11 -
 12
12 -
 13
13 -
 14
14 -
 15
15 -
 16
16 -
 17
17 -
 18
18 -
 19
19 -
 20
20 -
 21
21 -
 22
22 -
 23
23 -
24
-
25
-
26
-
27
-
28
-
29
-
30
-
31
-
32
-
33
-
34
-
35
-
36
-
37
-
38
-
39
-
40
-
41
-
42
-
43
-
44
-
45
-
46
-
47
-
48
-
49
-
50
-
51
-
52
-
53
-
54
-
55
-
56
-
57
-
58
-
59
-
60
-
61
-
62
-
63
-
64
-
65
-
66
-
67
-
68
-
69
-
70
-
71
-
72
-
73
-
74
-
75
-
76
-
77
-
78
-
79
-
80
 |
 |

AT&T Inc. | 11
Management’s Discussion and Analysis of Financial Condition and Results of Operations
Dollars in millions except per share amounts
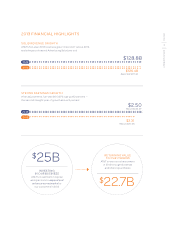
Operating revenues increased $1,318, or 1.0%, in 2013
and $711, or 0.6%, in 2012. The increases in 2013 and
2012 are primarily due to growth in wireless data and
equipment revenues, reflecting the increasing percentage
of wireless subscribers choosing smartphones. Higher
wireline data revenues from U-verse residential customers
and strategic business services also contributed to revenue
growth. These increases were mostly offset by continued
declines in wireline voice revenues for both years. The sale
of our Advertising Solutions segment lowered revenues
$1,049 in 2013 and $2,244 in 2012.
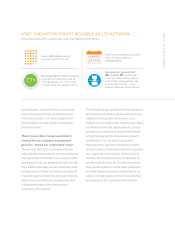
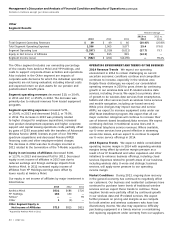
The telecommunications industry is rapidly evolving from
fixed location, voice-oriented services into an industry
driven by customer demand for instantly available, data-
based services (including video). Our products, services
and plans are changing as we transition to sophisticated,
high-speed, IP-based alternatives. We are also re-designing
our networks to accommodate these new demands and to
take advantage of related technological efficiencies.
OVERVIEW
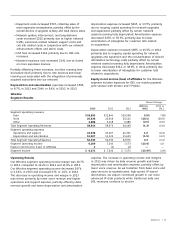
Operating income increased $17,482 in 2013 and
$3,779, or 41.0%, in 2012. Our operating margin was
23.7% in 2013, compared to 10.2% in 2012 and 7.3% in
2011. Operating income for 2013 increased $17,578 due
to a noncash actuarial gain of $7,584 related to pension
and postemployment benefit plans in 2013 and an
actuarial loss of $9,994 in 2012. Operating income for
2013 also reflects continued growth in wireless data
revenue, and increased revenues from AT&T U-verse®
(U-verse) and strategic business services. Partially
offsetting these increases were continued declines in
our traditional voice and data services, higher wireless
equipment costs and increased expenses supporting
U-verse subscriber growth. Operating income for 2012
included actuarial losses of $9,994, and reflected a partial
year’s results for our sold Advertising Solutions segment.
Operating income for 2011 included actuarial losses of
$6,280, charges of $4,181 related to our decision to
terminate the acquisition of T-Mobile USA, Inc. (T-Mobile)
and noncash charges of $2,910 related to impairments
of directory intangible assets.
For ease of reading, AT&T Inc. is referred to as “we,” “AT&T” or the “Company” throughout this document, and the
names of the particular subsidiaries and affiliates providing the services generally have been omitted. AT&T is a holding
company whose subsidiaries and affiliates operate in the communications services industry in both the United States and
internationally, providing wireless and wireline telecommunications services and equipment. You should read this discussion
in conjunction with the consolidated financial statements and accompanying notes. A reference to a “Note” in this section
refers to the accompanying Notes to Consolidated Financial Statements. In the tables throughout this section, percentage
increases and decreases that are not considered meaningful are denoted with a dash.
RESULTS OF OPERATIONS
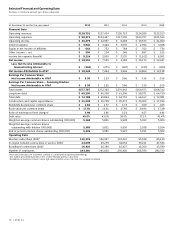
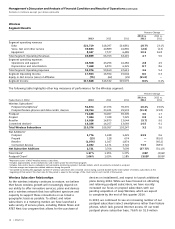
Consolidated Results Our financial results are summarized in the table below. We then discuss factors affecting our overall
results for the past three years. These factors are discussed in more detail in our “Segment Results” section. We also discuss
our expected revenue and expense trends for 2014 in the “Operating Environment and Trends of the Business” section.
Percent Change
2013 vs. 2012 vs.
2013 2012 2011 2012 2011
Operating Revenues $128,752 $127,434 $126,723 1.0% 0.6%
Operating expenses
Cost of services and sales 51,464 55,228 54,904 (6.8) 0.6
Selling, general and administrative 28,414 41,066 41,314 (30.8) (0.6)
Impairment of intangible assets — — 2,910 — —
Depreciation and amortization 18,395 18,143 18,377 1.4 (1.3)
Total Operating Expenses 98,273 114,437 117,505 (14.1) (2.6)
Operating Income 30,479 12,997 9,218 — 41.0
Interest expense 3,940 3,444 3,535 14.4 (2.6)
Equity in net income of affiliates 642 752 784 (14.6) (4.1)
Other income (expense) – net 596 134 249 — (46.2)
Income Before Income Taxes 27,777 10,439 6,716 — 55.4
Net Income 18,553 7,539 4,184 — 80.2
Net Income Attributable to AT&T $ 18,249 $ 7,264 $ 3,944 — 84.2%