AT&T Wireless 2013 Annual Report Download - page 21
Download and view the complete annual report
Please find page 21 of the 2013 AT&T Wireless annual report below. You can navigate through the pages in the report by either clicking on the pages listed below, or by using the keyword search tool below to find specific information within the annual report.-
 1
1 -
2
-
3
-
4
-
5
-
6
-
7
-
8
-
9
-
10
-
 11
11 -
 12
12 -
 13
13 -
 14
14 -
 15
15 -
 16
16 -
 17
17 -
 18
18 -
 19
19 -
 20
20 -
 21
21 -
 22
22 -
 23
23 -
 24
24 -
 25
25 -
 26
26 -
 27
27 -
 28
28 -
 29
29 -
 30
30 -
 31
31 -
32
-
33
-
34
-
35
-
36
-
37
-
38
-
39
-
40
-
41
-
42
-
43
-
44
-
45
-
46
-
47
-
48
-
49
-
50
-
51
-
52
-
53
-
54
-
55
-
56
-
57
-
58
-
59
-
60
-
61
-
62
-
63
-
64
-
65
-
66
-
67
-
68
-
69
-
70
-
71
-
72
-
73
-
74
-
75
-
76
-
77
-
78
-
79
-
80
 |
 |

AT&T Inc. | 19
Supplemental Information
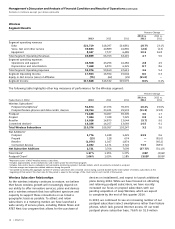
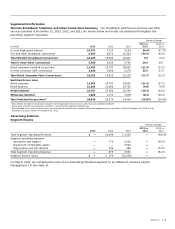
Wireline Broadband, Telephone and Video Connections Summary Our broadband, switched access lines and other
services provided at December 31, 2013, 2012, and 2011 are shown below and trends are addressed throughout the
preceding segment discussion.
Percent Change
2013 vs. 2012 vs.
(in 000s) 2013 2012 2011 2012 2011
U-verse high speed Internet 10,375 7,717 5,224 34.4% 47.7%
DSL and other broadband connections 6,050 8,673 11,203 (30.2) (22.6)
Total Wireline Broadband Connections1 16,425 16,390 16,427 0.2 (0.2)
Total U-verse Video Connections 5,460 4,536 3,791 20.4 19.7
Retail consumer switched access lines 12,403 15,707 18,952 (21.0) (17.1)
U-verse consumer VoIP connections 3,848 2,905 2,278 32.5 27.5
Total Retail Consumer Voice Connections2 16,251 18,612 21,230 (12.7) (12.3)
Switched Access Lines
Retail consumer 12,403 15,707 18,952 (21.0) (17.1)
Retail business 10,364 11,484 12,750 (9.8) (9.9)
Retail Subtotal2 22,767 27,191 31,702 (16.3) (14.2)
Wholesale Subtotal2 1,626 1,775 1,978 (8.4) (10.3)
Total Switched Access Lines2,3 24,639 29,279 34,054 (15.8)% (14.0)%
1 Total wireline broadband connections include U-verse high speed Internet access, DSL lines and satellite broadband.
2 Prior-period amounts are restated to conform to current-period reporting methodology.
3 Total switched access lines include access lines provided to national mass markets and private payphone service providers of 246 at December 31, 2013, 313 at
December 31, 2012, and 374 at December 31, 2011.
Advertising Solutions
Segment Results
Percent Change
2013 vs. 2012 vs.
2013 2012 2011 2012 2011
Total Segment Operating Revenues $ — $1,049 $ 3,293 — (68.1)%
Segment operating expenses
Operations and support — 773 2,265 — (65.9)
Impairment of intangible assets — — 2,910 — —
Depreciation and amortization — 106 386 — (72.5)
Total Segment Operating Expenses — 879 5,561 — (84.2)
Segment Income (Loss) $ — $ 170 $(2,268) — —
On May 8, 2012, we completed the sale of our Advertising Solutions segment to an affiliate of Cerberus Capital
Management, L.P. (see Note 5).