AT&T Wireless 2013 Annual Report Download - page 69
Download and view the complete annual report
Please find page 69 of the 2013 AT&T Wireless annual report below. You can navigate through the pages in the report by either clicking on the pages listed below, or by using the keyword search tool below to find specific information within the annual report.-
 1
1 -
2
-
3
-
4
-
5
-
6
-
7
-
8
-
9
-
10
-
11
-
12
-
13
-
14
-
15
-
16
-
17
-
18
-
19
-
20
-
21
-
22
-
23
-
24
-
25
-
26
-
27
-
28
-
29
-
30
-
31
-
32
-
33
-
34
-
35
-
36
-
37
-
38
-
39
-
40
-
41
-
42
-
43
-
44
-
45
-
46
-
47
-
48
-
49
-
50
-
51
-
52
-
53
-
54
-
55
-
56
-
57
-
58
-
 59
59 -
 60
60 -
 61
61 -
 62
62 -
 63
63 -
 64
64 -
 65
65 -
 66
66 -
 67
67 -
 68
68 -
 69
69 -
 70
70 -
 71
71 -
 72
72 -
 73
73 -
 74
74 -
 75
75 -
 76
76 -
 77
77 -
 78
78 -
 79
79 -
80
 |
 |

AT&T Inc. | 67
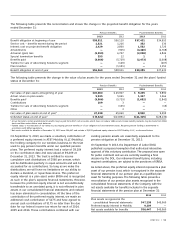
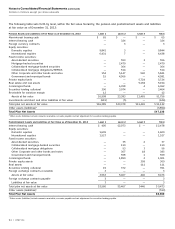
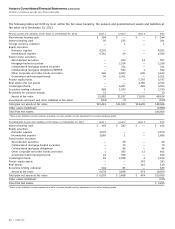
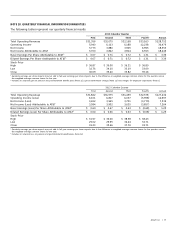
The tables below set forth a summary of changes in the fair value of the Level 3 pension and postretirement assets for the
year ended December 31, 2012:
Fixed Private Real Estate
Income Equity and
Pension Assets Equities Funds Funds Real Assets Total
Balance at beginning of year $ 4 $ 824 $ 5,931 $ 5,213 $11,972
Realized gains (losses) (1) 16 459 165 639
Unrealized gains (losses) 1 33 32 10 76
Transfers in — 120 12 24 156
Transfers out — (2) — — (2)
Purchases — 142 610 918 1,670
Sales (4) (91) (1,247) (1,564) (2,906)
Balance at end of year $ — $1,042 $ 5,797 $ 4,766 $11,605
Fixed Private
Income Equity
Postretirement Assets Funds Funds Real Assets Total
Balance at beginning of year $24 $ 437 $ 124 $ 585
Realized gains (losses) — 58 16 74
Unrealized gains (losses) — (39) (5) (44)
Purchases — 20 33 53
Sales (3) (133) (58) (194)
Balance at end of year $21 $ 343 $ 110 $ 474
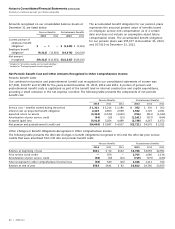
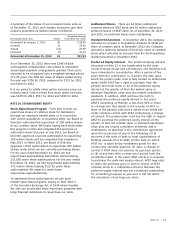
Supplemental Retirement Plans
We also provide certain senior- and middle-management
employees with nonqualified, unfunded supplemental
retirement and savings plans. While these plans are
unfunded, we have assets in a designated nonbankruptcy
remote trust that are independently managed and used to
provide for these benefits. These plans include supplemental
pension benefits as well as compensation-deferral plans,
some of which include a corresponding match by us based
on a percentage of the compensation deferral.
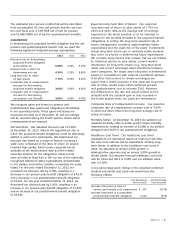
We use the same significant assumptions for the discount
rate and composite rate of compensation increase used in
determining the projected benefit obligation and the net
pension and postemployment benefit cost. The following
tables provide the plans’ benefit obligations and fair value
of assets at December 31 and the components of the
supplemental retirement pension benefit cost. The net
amounts are recorded as “Other noncurrent liabilities”
on our consolidated balance sheets.
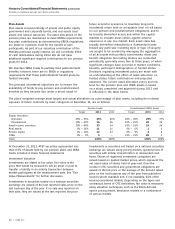
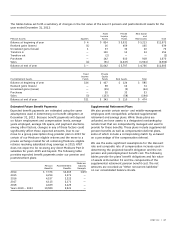
Estimated Future Benefit Payments
Expected benefit payments are estimated using the same
assumptions used in determining our benefit obligation at
December 31, 2013. Because benefit payments will depend
on future employment and compensation levels, average
years employed, average life spans, and payment elections,
among other factors, changes in any of these factors could
significantly affect these expected amounts. Due to our
move to a group prescription drug provider plan in 2013 for
certain of our Medicare eligible retirees and the move to a
private exchange market for all remaining Medicare eligible
retirees receiving subsidized drug coverage in 2015, AT&T
does not expect to be receiving any direct Medicare Part D
subsidies for years 2015 and beyond. The following table
provides expected benefit payments under our pension and
postretirement plans:
Medicare
Pension Postretirement Subsidy
Benefits Benefits Receipts
2014 $ 7,376 $2,265 $(19)
2015 4,294 2,271 —
2016 4,197 2,222 —
2017 4,115 2,171 —
2018 4,029 2,129 —
Years 2019 – 2023 19,589 9,921 —