AT&T Wireless 2013 Annual Report Download - page 19
Download and view the complete annual report
Please find page 19 of the 2013 AT&T Wireless annual report below. You can navigate through the pages in the report by either clicking on the pages listed below, or by using the keyword search tool below to find specific information within the annual report.-
 1
1 -
2
-
3
-
4
-
5
-
6
-
7
-
8
-
 9
9 -
 10
10 -
 11
11 -
 12
12 -
 13
13 -
 14
14 -
 15
15 -
 16
16 -
 17
17 -
 18
18 -
 19
19 -
 20
20 -
 21
21 -
 22
22 -
 23
23 -
 24
24 -
 25
25 -
 26
26 -
 27
27 -
 28
28 -
 29
29 -
30
-
31
-
32
-
33
-
34
-
35
-
36
-
37
-
38
-
39
-
40
-
41
-
42
-
43
-
44
-
45
-
46
-
47
-
48
-
49
-
50
-
51
-
52
-
53
-
54
-
55
-
56
-
57
-
58
-
59
-
60
-
61
-
62
-
63
-
64
-
65
-
66
-
67
-
68
-
69
-
70
-
71
-
72
-
73
-
74
-
75
-
76
-
77
-
78
-
79
-
80
 |
 |

AT&T Inc. | 17
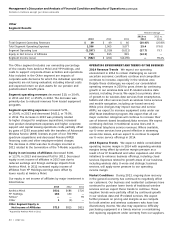
depreciation expense increased $865, or 13.5%, primarily
due to ongoing capital spending for network upgrades
and expansions partially offset by certain network
assets becoming fully depreciated. Amortization expense
decreased $270, or 55.3%, primarily due to lower
amortization of intangibles for customer lists related
to acquisitions.
Depreciation expense increased $855, or 15.5%, in 2012
primarily due to ongoing capital spending for network
upgrades and expansion and the reclassification of shared
information technology costs partially offset by certain
network assets becoming fully depreciated. Amortization
expense decreased $311, or 38.9%, in 2012 primarily due
to lower amortization of intangibles for customer lists
related to acquisitions.
Equity in net income (loss) of affiliates for the Wireless
segment includes expenses for ISIS, our mobile payment
joint venture with Verizon and T-Mobile.
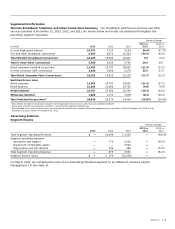
• Equipment costs increased $507, reflecting sales of
more expensive smartphones, partially offset by the
overall decline in upgrade activity and total device sales.
• Network system, interconnect, and long-distance
costs increased $202 primarily due to higher network
traffic, personnel-related network support costs and
cell site related costs in conjunction with our network
enhancement efforts and storm costs.
• USF fees increased $166 primarily due to USF rate
increases.
• Handset insurance cost increased $141 due to claims
on more expensive devices.
Partially offsetting these increases, incollect roaming fees
decreased $115 primarily due to rate declines and lower
roaming use associated with the integration of previously
acquired subscribers into our network.
Depreciation and amortization expenses increased $595,
or 8.7%, in 2013 and $544, or 8.6%, in 2012. In 2013,
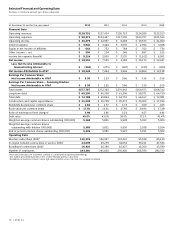
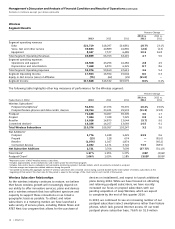
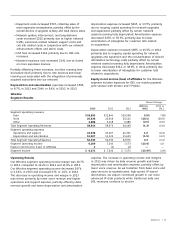
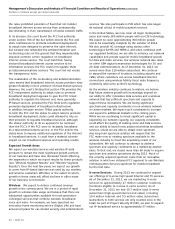
Wireline
Segment Results
Percent Change
2013 vs. 2012 vs.
2013 2012 2011 2012 2011
Segment operating revenues
Data $33,593 $31,841 $29,548 5.5% 7.8%
Voice 20,333 22,614 25,121 (10.1) (10.0)
Other 4,888 5,118 5,480 (4.5) (6.6)
Total Segment Operating Revenues 58,814 59,573 60,149 (1.3) (1.0)
Segment operating expenses
Operations and support 41,638 41,207 41,361 1.0 (0.4)
Depreciation and amortization 10,907 11,123 11,615 (1.9) (4.2)
Total Segment Operating Expenses 52,545 52,330 52,976 0.4 (1.2)
Segment Operating Income 6,269 7,243 7,173 (13.4) 1.0
Equity in Net Income (Loss) of Affiliates 2 (1) (2) — —
Segment Income $ 6,271 $ 7,242 $ 7,171 (13.4)% 1.0%
expense. The increase in operating income and margins
in 2012 was driven by data revenue growth and lower
depreciation and amortization expense, partially offset by
lower voice revenue. As we transition from basic voice and
data services to sophisticated, high-speed, IP-based
alternatives, we expect continued growth in our more
advanced IP data products while traditional data and
DSL revenues continue to decline.
Operating Results
Our Wireline segment operating income margin was 10.7%
in 2013, compared to 12.2% in 2012 and 11.9% in 2011.
Our Wireline segment operating income decreased $974,
or 13.4%, in 2013 and increased $70, or 1.0%, in 2012.
The decrease in operating income and margin in 2013
was driven primarily by lower voice revenue and higher
operations and support expense, partially offset by data
revenue growth and lower depreciation and amortization