AT&T Wireless 2013 Annual Report Download - page 14
Download and view the complete annual report
Please find page 14 of the 2013 AT&T Wireless annual report below. You can navigate through the pages in the report by either clicking on the pages listed below, or by using the keyword search tool below to find specific information within the annual report.-
 1
1 -
2
-
3
-
 4
4 -
 5
5 -
 6
6 -
 7
7 -
 8
8 -
 9
9 -
 10
10 -
 11
11 -
 12
12 -
 13
13 -
 14
14 -
 15
15 -
 16
16 -
 17
17 -
 18
18 -
 19
19 -
 20
20 -
 21
21 -
 22
22 -
 23
23 -
 24
24 -
25
-
26
-
27
-
28
-
29
-
30
-
31
-
32
-
33
-
34
-
35
-
36
-
37
-
38
-
39
-
40
-
41
-
42
-
43
-
44
-
45
-
46
-
47
-
48
-
49
-
50
-
51
-
52
-
53
-
54
-
55
-
56
-
57
-
58
-
59
-
60
-
61
-
62
-
63
-
64
-
65
-
66
-
67
-
68
-
69
-
70
-
71
-
72
-
73
-
74
-
75
-
76
-
77
-
78
-
79
-
80
 |
 |

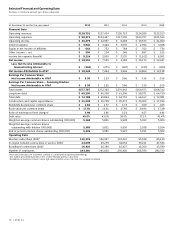
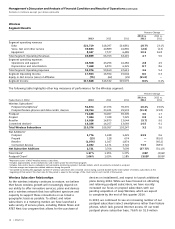
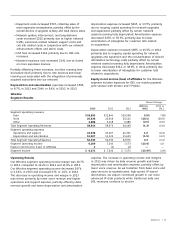
Management’s Discussion and Analysis of Financial Condition and Results of Operations (continued)
Dollars in millions except per share amounts
12 | AT&T Inc.
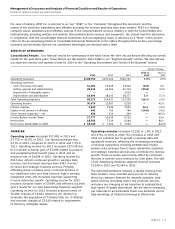
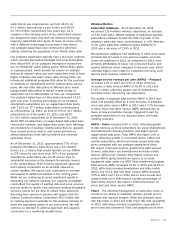
Depreciation and amortization expense increased
$252, or 1.4%, in 2013 and decreased $234, or 1.3%,
in 2012. The 2013 expense increase was primarily due
to ongoing capital spending for network upgrades and
expansion, partially offset by fully depreciated assets
and lower amortization of intangibles for customer lists
related to acquisitions and the sale of our Advertising
Solutions segment.
The 2012 expense decrease was primarily due to the
sale of our Advertising Solutions segment and lower
amortization of intangibles for customer lists related to
acquisitions, offset by increased depreciation associated
with ongoing capital spending for network upgrades
and expansion.
Interest expense increased $496, or 14.4%, in 2013 and
decreased $91, or 2.6%, in 2012. The increase was due
to a $581 charge related to our debt tender offers in
2013, partially offset by charges associated with early
debt redemptions in 2012. Lower average interest rates
offset higher average debt balances.
The decrease in interest expense for 2012 was primarily
due to lower average interest rates and average debt
balances, partially offset by one-time charges associated
with early debt redemptions.
Equity in net income of affiliates decreased $110, or
14.6%, in 2013 and $32, or 4.1%, in 2012. Decreased equity
in net income of affiliates in both periods was due to lower
earnings from América Móvil, S.A. de C.V. (América Móvil),
and increased expenses in our mobile payment joint
venture with other wireless carriers, marketed as the
Isis Mobile WalletTM (ISIS). These decreases were partially
offset by earnings from YP Holdings LLC (YP Holdings).
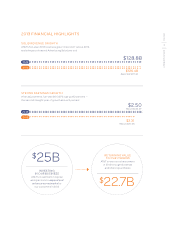
Other income (expense) – net We had other income
of $596 in 2013, $134 in 2012 and $249 in 2011. Results
for 2013 included a net gain on the sale of América Móvil
shares and other investments of $498, interest and dividend
income of $68, and leveraged lease income of $26.
Other income for 2012 included interest and dividend
income of $61, leveraged lease income of $55 and net
gains on the sale of investments of $74. This income
was partially offset by $57 of investment impairments.
Results for 2011 included interest and dividend income
of $73, leveraged lease income of $80 and net gains on
the sale of investments of $97.
Income tax expense increased $6,324 in 2013 and
$368 in 2012. Both increases were primarily due to an
increase in income before income taxes. Our effective
tax rate was 33.2% in 2013, 27.8% in 2012 and 37.7%
in 2011 (see Note 11).
We expect continued growth in our wireless and wireline
IP-based data revenues as we bundle and price plans
with greater focus on data and video services. We expect
continued declines in voice revenues and our basic
wireline data services as customers choose these next-
generation services.
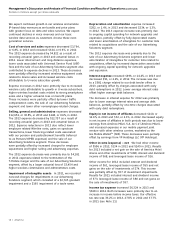
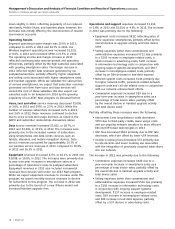
Cost of services and sales expenses decreased $3,764,
or 6.8%, in 2013 and increased $324, or 0.6%, in 2012.
The 2013 expense decreased by $4,822 as a result of
recording actuarial gains in 2013 and actuarial losses in
2012. Lower interconnect and long-distance expenses,
lower costs associated with Universal Service Fund (USF)
fees and the sale of our Advertising Solutions segment also
contributed to expense declines in 2013. These decreases
were partially offset by increased wireless equipment costs
related to device sales and increased wireline costs
attributable to U-verse subscriber growth.
Expense increases in 2012 were primarily due to increased
wireline costs attributable to growth in U-verse subscribers,
higher wireless handset costs related to strong smartphone
sales and a higher actuarial loss on benefit plans.
These increases were partially offset by lower traffic
compensation costs, the sale of our Advertising Solutions
segment and lower other nonemployee-related charges.
Selling, general and administrative expenses decreased
$12,652, or 30.8%, in 2013 and $248, or 0.6%, in 2012.
The 2013 expense decreased by $12,757 as a result of
recording actuarial gains in 2013 and actuarial losses in
2012. Expense reductions in 2013 also reflect lower
employee related Wireline costs, gains on spectrum
transactions, lower financing-related costs associated
with our pension and postretirement benefits (referred
to as Pension/OPEB expenses) and the sale of our
Advertising Solutions segment. These decreases
were partially offset by increased charges for employee
separations and higher selling and advertising expenses.
The 2012 expense decrease was primarily due to $4,181
in 2011 expenses related to the termination of the
T-Mobile merger and the sale of our Advertising Solutions
segment, offset by a larger actuarial loss of $3,454 and
higher wireless commissions and administrative costs.
Impairment of intangible assets In 2011, we recorded
noncash charges for impairments in our Advertising
Solutions segment, which consisted of a $2,745 goodwill
impairment and a $165 impairment of a trade name.