AT&T Wireless 2013 Annual Report Download - page 36
Download and view the complete annual report
Please find page 36 of the 2013 AT&T Wireless annual report below. You can navigate through the pages in the report by either clicking on the pages listed below, or by using the keyword search tool below to find specific information within the annual report.-
 1
1 -
2
-
3
-
4
-
5
-
6
-
7
-
8
-
9
-
10
-
11
-
12
-
13
-
14
-
15
-
16
-
17
-
18
-
19
-
20
-
21
-
22
-
23
-
24
-
25
-
 26
26 -
 27
27 -
 28
28 -
 29
29 -
 30
30 -
 31
31 -
 32
32 -
 33
33 -
 34
34 -
 35
35 -
 36
36 -
 37
37 -
 38
38 -
 39
39 -
 40
40 -
 41
41 -
 42
42 -
 43
43 -
 44
44 -
 45
45 -
 46
46 -
47
-
48
-
49
-
50
-
51
-
52
-
53
-
54
-
55
-
56
-
57
-
58
-
59
-
60
-
61
-
62
-
63
-
64
-
65
-
66
-
67
-
68
-
69
-
70
-
71
-
72
-
73
-
74
-
75
-
76
-
77
-
78
-
79
-
80
 |
 |

Management’s Discussion and Analysis of Financial Condition and Results of Operations (continued)
Dollars in millions except per share amounts
34 | AT&T Inc.
For the purpose of assessing specific risks, we use a
sensitivity analysis to determine the effects that market risk
exposures may have on the fair value of our financial
instruments and results of operations. To perform the
sensitivity analysis, we assess the risk of loss in fair values
from the effect of a hypothetical 10% depreciation of the
U.S. dollar against foreign currencies from the prevailing
foreign currency exchange rates, assuming no change in
interest rates. We had no foreign exchange forward
contracts outstanding at December 31, 2013.
In anticipation of other foreign currency-denominated
transactions, we often enter into foreign exchange
forward contracts to provide currency at a fixed rate.
Our policy is to measure the risk of adverse currency
fluctuations by calculating the potential dollar losses
resulting from changes in exchange rates that have a
reasonable probability of occurring. We cover the
exposure that results from changes that exceed
acceptable amounts.
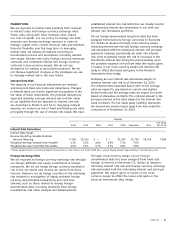
STOCK PERFORMANCE GRAPH
Comparison of Five Year Cumulative Total Return
AT&T Inc., S&P 500 Index, and S&P 500 Integrated Telecom Index
240
220
200
180
160
140
120
100
80
12/08 12/09 12/10 12/11 12/12 12/13
S&P 500 Integrated
Telecom Index
AT&T Inc. S&P 500 Index
126
128
165
117
150
105
157
174
137
106
126
145 149
172
228
The comparison above assumes $100 invested on December 31, 2008, in AT&T common stock, Standard & Poor’s 500 Index
(S&P 500), and Standard & Poor’s 500 Integrated Telecom Index (S&P 500 Integrated Telecom). Total return equals stock
price appreciation plus reinvestment of dividends.
The current U.S. economy has changed our customers’
buying habits and a failure to adequately respond could
materially adversely affect our business.
We provide services and products to consumers and large
and small businesses in the United States and to larger
businesses throughout the world. The current slow
economic recovery in the United States continues to
pressure our customers’ demand for and ability to pay
for existing services, especially local landline service, and
their interest in purchasing new services. Customers are
changing their buying habits in response to both ongoing
RISK FACTORS
In addition to the other information set forth in this
document, including the matters contained under the
caption “Cautionary Language Concerning Forward-
Looking Statements,” you should carefully read the matters
described below. We believe that each of these matters
could materially affect our business. We recognize that
most of these factors are beyond our ability to control and
therefore we cannot predict an outcome. Accordingly, we
have organized them by first addressing general factors,
then industry factors and, finally, items specifically
applicable to us.