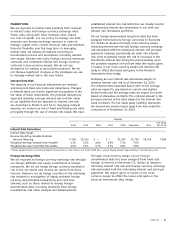
AT&T Wireless 2013 Annual Report Download - page 43
Download and view the complete annual report
Please find page 43 of the 2013 AT&T Wireless annual report below. You can navigate through the pages in the report by either clicking on the pages listed below, or by using the keyword search tool below to find specific information within the annual report.-
 1
1 -
2
-
3
-
4
-
5
-
6
-
7
-
8
-
9
-
10
-
11
-
12
-
13
-
14
-
15
-
16
-
17
-
18
-
19
-
20
-
21
-
22
-
23
-
24
-
25
-
26
-
27
-
28
-
29
-
30
-
31
-
32
-
 33
33 -
 34
34 -
 35
35 -
 36
36 -
 37
37 -
 38
38 -
 39
39 -
 40
40 -
 41
41 -
 42
42 -
 43
43 -
 44
44 -
 45
45 -
 46
46 -
 47
47 -
 48
48 -
 49
49 -
 50
50 -
 51
51 -
 52
52 -
 53
53 -
54
-
55
-
56
-
57
-
58
-
59
-
60
-
61
-
62
-
63
-
64
-
65
-
66
-
67
-
68
-
69
-
70
-
71
-
72
-
73
-
74
-
75
-
76
-
77
-
78
-
79
-
80
 |
 |

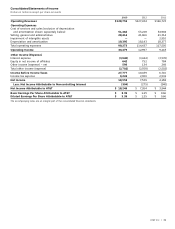
AT&T Inc. | 41
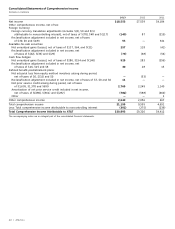
Consolidated Balance Sheets
Dollars in millions except per share amounts
December 31,
2013 2012
Assets
Current Assets
Cash and cash equivalents $ 3,339 $ 4,868
Accounts receivable – net of allowances for doubtful accounts of $483 and $547 12,918 12,657
Prepaid expenses 960 1,035
Deferred income taxes 1,199 1,036
Other current assets 4,780 3,110
Total current assets 23,196 22,706
Property, Plant and Equipment – Net 110,968 109,767
Goodwill 69,273 69,773
Licenses 56,433 52,352
Customer Lists and Relationships – Net 763 1,391
Other Intangible Assets – Net 5,016 5,032
Investments in and Advances to Equity Affiliates 3,860 4,581
Other Assets 8,278 6,713
Total Assets $277,787 $272,315
Liabilities and Stockholders’ Equity
Current Liabilities
Debt maturing within one year $ 5,498 $ 3,486
Accounts payable and accrued liabilities 21,107 20,494
Advanced billings and customer deposits 4,212 4,225
Accrued taxes 1,774 1,026
Dividends payable 2,404 2,556
Total current liabilities 34,995 31,787
Long-Term Debt 69,290 66,358
Deferred Credits and Other Noncurrent Liabilities
Deferred income taxes 36,308 28,491
Postemployment benefit obligation 29,946 41,392
Other noncurrent liabilities 15,766 11,592
Total deferred credits and other noncurrent liabilities 82,020 81,475
Stockholders’ Equity
Common stock ($1 par value, 14,000,000,000 authorized at December 31, 2013
and 2012: issued 6,495,231,088 at December 31, 2013 and 2012) 6,495 6,495
Additional paid-in capital 91,091 91,038
Retained earnings 31,141 22,481
Treasury stock (1,268,914,913 at December 31, 2013 and 913,836,325
at December 31, 2012, at cost) (45,619) (32,888)
Accumulated other comprehensive income 7,880 5,236
Noncontrolling interest 494 333
Total stockholders’ equity 91,482 92,695
Total Liabilities and Stockholders’ Equity $277,787 $272,315
The accompanying notes are an integral part of the consolidated financial statements.