AT&T Wireless 2013 Annual Report Download - page 18
Download and view the complete annual report
Please find page 18 of the 2013 AT&T Wireless annual report below. You can navigate through the pages in the report by either clicking on the pages listed below, or by using the keyword search tool below to find specific information within the annual report.-
 1
1 -
2
-
3
-
4
-
5
-
6
-
7
-
 8
8 -
 9
9 -
 10
10 -
 11
11 -
 12
12 -
 13
13 -
 14
14 -
 15
15 -
 16
16 -
 17
17 -
 18
18 -
 19
19 -
 20
20 -
 21
21 -
 22
22 -
 23
23 -
 24
24 -
 25
25 -
 26
26 -
 27
27 -
 28
28 -
29
-
30
-
31
-
32
-
33
-
34
-
35
-
36
-
37
-
38
-
39
-
40
-
41
-
42
-
43
-
44
-
45
-
46
-
47
-
48
-
49
-
50
-
51
-
52
-
53
-
54
-
55
-
56
-
57
-
58
-
59
-
60
-
61
-
62
-
63
-
64
-
65
-
66
-
67
-
68
-
69
-
70
-
71
-
72
-
73
-
74
-
75
-
76
-
77
-
78
-
79
-
80
 |
 |

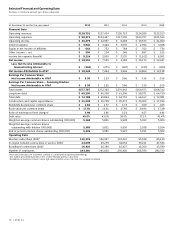
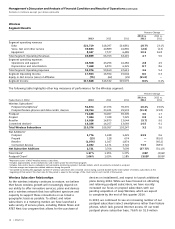
Management’s Discussion and Analysis of Financial Condition and Results of Operations (continued)
Dollars in millions except per share amounts
16 | AT&T Inc.
Operations and support expenses increased $1,212,
or 2.8%, in 2013 and $2,014, or 4.9%, in 2012. The increase
in 2013 was primarily due to the following:
• Equipment costs increased $817, reflecting sales of
more expensive smartphones, partially offset by the
overall decline in upgrade activity and total device
sales.
• Selling expenses (other than commissions) and
administrative expenses increased $712 due primarily
to a $265 increase in employee-related costs, a
$246 increase in advertising costs, $187 increase
in information technology costs in conjunction with
ongoing support systems development, and $107
increase in nonemployee-related costs, partially
offset by an $84 decrease in bad debt expense.
• Network system costs increased $146 primarily due
to higher network traffic, personnel-related network
support costs and cell site related costs in conjunction
with our network enhancement efforts.
• Commission expenses increased $59 due to a
year-over-year increase in smartphone sales as a
percentage of total device sales, partially offset
by the overall decline in handset upgrade activity
and total device sales.
Partially offsetting these increases were the following:
• Interconnect and long-distance costs decreased
$353 due to third-party credits, lower usage costs
and our ongoing network transition to more efficient
Ethernet/IP-based technologies in 2013.
• USF fees decreased $104 primarily due to USF rate
decreases, which are offset by lower USF revenues.
• Incollect roaming fees decreased $73 primarily due
to rate declines and lower roaming use associated
with the integration of previously acquired subscribers
into our network.
The increase in 2012 was primarily due to the following:
• Commission expenses increased $636 due to a
year-over-year increase in smartphone sales as a
percentage of total device sales, partially offset by
the overall decline in handset upgrade activity and
total device sales.
• Selling expenses (other than commissions) and
administrative expenses increased $526 due primarily
to a $181 increase in information technology costs
in conjunction with ongoing support systems
development, $137 increase in employee-related
costs, $99 increase in nonemployee-related costs,
and $89 increase in bad debt expense, partially
offset by a $57 decline in advertising costs.
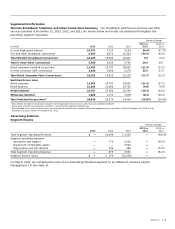
down slightly in 2012, reflecting popularity of our reduced-
rate family, Mobile Share, and business plans; however, the
decrease was mostly offset by the disconnection of reseller
low-revenue accounts.
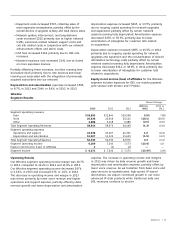
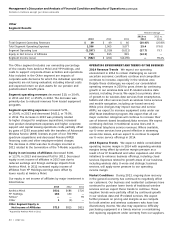
Operating Results
Segment operating income margin was 25.6% in 2013,
compared to 24.9% in 2012 and 24.7% in 2011. Our
Wireless segment operating income increased $1,329,
or 8.0%, in 2013 and increased $990, or 6.3%, in 2012.
The operating income and margin increase in 2013
reflected continuing data revenue growth and operating
efficiencies, partially offset by the high subsidies associated
with growing smartphone sales. The margin increase in
2012 reflected higher data revenues generated by our
postpaid subscribers, partially offset by higher equipment
and selling costs associated with higher smartphone sales
and handset upgrades. While we subsidize the sales prices
of various smartphones, we expect that subscriber revenues
generated over time from voice and data services will
exceed the cost of those subsidies. We also expect our
subsidies costs to be tempered in 2014 by the growing
popularity of our AT&T Next program, as discussed below.
Voice, text and other service revenues decreased $1,056,
or 2.6%, in 2013 and $976, or 2.3%, in 2012. While the
number of wireless subscribers increased 3.2% in 2013,
and 3.6% in 2012, these revenues continued to decline
due to voice access and usage declines, as noted in the
ARPU and subscriber relationships discussions above.
Data service revenues increased $3,422, or 18.7%, in
2013 and $3,436, or 23.1%, in 2012. The increases were
primarily due to the increased number of subscribers
using smartphones and data-centric devices, such as
tablets, eReaders, and mobile navigation devices. Data
service revenues accounted for approximately 35.3% of
our wireless service revenues in 2013, compared to 30.9%
in 2012 and 26.2% in 2011.
Equipment revenues increased $770, or 10.2%, in 2013 and
$1,088, or 16.8%, in 2012. The increases were primarily due
to year-over-year increases in smartphone sales as a
percentage of total device sales to postpaid subscribers.
Equipment revenues in 2013 also included incremental
revenues from devices sold under our AT&T Next program.
While we expect equipment revenues to increase under this
program, we expect monthly services revenues to decline
for subscribers to this program. The increase in 2012 was
primarily due to the launch of a new iPhone model and
increased handset upgrade fees.