AT&T Wireless 2013 Annual Report Download - page 50
Download and view the complete annual report
Please find page 50 of the 2013 AT&T Wireless annual report below. You can navigate through the pages in the report by either clicking on the pages listed below, or by using the keyword search tool below to find specific information within the annual report.-
 1
1 -
2
-
3
-
4
-
5
-
6
-
7
-
8
-
9
-
10
-
11
-
12
-
13
-
14
-
15
-
16
-
17
-
18
-
19
-
20
-
21
-
22
-
23
-
24
-
25
-
26
-
27
-
28
-
29
-
30
-
31
-
32
-
33
-
34
-
35
-
36
-
37
-
38
-
39
-
 40
40 -
 41
41 -
 42
42 -
 43
43 -
 44
44 -
 45
45 -
 46
46 -
 47
47 -
 48
48 -
 49
49 -
 50
50 -
 51
51 -
 52
52 -
 53
53 -
 54
54 -
 55
55 -
 56
56 -
 57
57 -
 58
58 -
 59
59 -
 60
60 -
61
-
62
-
63
-
64
-
65
-
66
-
67
-
68
-
69
-
70
-
71
-
72
-
73
-
74
-
75
-
76
-
77
-
78
-
79
-
80
 |
 |

Notes to Consolidated Financial Statements (continued)
Dollars in millions except per share amounts
48 | AT&T Inc.
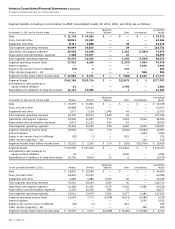
Segment Results, including a reconciliation to AT&T consolidated results, for 2013, 2012, and 2011 are as follows:
Advertising Consolidated
At December 31, 2013 and for the year ended Wireless Wireline Solutions Other Consolidations Results
Data $ 21,719 $ 33,593 $ — $ — $ — $ 55,312
Voice, text and other 39,833 20,333 — — — 60,166
Equipment and other 8,347 4,888 — 39 — 13,274
Total segment operating revenues 69,899 58,814 — 39 — 128,752
Operations and support expenses 44,508 41,638 — 1,316 (7,584) 79,878
Depreciation and amortization expenses 7,468 10,907 — 20 — 18,395
Total segment operating expenses 51,976 52,545 — 1,336 (7,584) 98,273
Segment operating income (loss) 17,923 6,269 — (1,297) 7,584 30,479
Interest expense — — — — 3,940 3,940
Equity in net income (loss) of affiliates (75) 2 — 715 — 642
Other income (expense) – net — — — — 596 596
Segment income (loss) before income taxes $ 17,848 $ 6,271 $ — $ (582) $ 4,240 $ 27,777
Segment Assets $141,196 $123,714 $ — $12,875 $ 2 $277,787
Investments in and advances to
equity method affiliates 61 — — 3,799 — 3,860
Expenditures for additions to long-lived assets 11,191 10,036 — 1 — 21,228
Advertising Consolidated
At December 31, 2012 and for the year ended Wireless Wireline Solutions Other Consolidations Results
Data $ 18,297 $ 31,841 $ — $ — $ — $ 50,138
Voice, text and other 40,889 22,614 — — — 63,503
Equipment and other 7,577 5,118 1,049 49 — 13,793
Total segment operating revenues 66,763 59,573 1,049 49 — 127,434
Operations and support expenses 43,296 41,207 773 1,024 9,994 96,294
Depreciation and amortization expenses 6,873 11,123 106 41 — 18,143
Total segment operating expenses 50,169 52,330 879 1,065 9,994 114,437
Segment operating income (loss) 16,594 7,243 170 (1,016) (9,994) 12,997
Interest expense — — — — 3,444 3,444
Equity in net income (loss) of affiliates (62) (1) — 815 — 752
Other income (expense) – net — — — — 134 134
Segment income (loss) before income taxes $ 16,532 $ 7,242 $ 170 $ (201) $(13,304) $ 10,439
Segment Assets $ 132,556 $ 125,340 $ — $ 14,416 $ 3 $ 272,315
Investments in and advances to
equity method affiliates 41 — — 4,540 — 4,581
Expenditures for additions to long-lived assets 10,795 8,914 13 6 — 19,728
Advertising Consolidated
For the year ended December 31, 2011 Wireless Wireline Solutions Other Consolidations Results
Data $ 14,861 $ 29,548 $ — $ — $ — $ 44,409
Voice, text and other 41,865 25,121 — — — 66,986
Equipment and other 6,489 5,480 3,293 66 — 15,328
Total segment operating revenues 63,215 60,149 3,293 66 — 126,723
Operations and support expenses 41,282 41,361 5,175 5,030 6,280 99,128
Depreciation and amortization expenses 6,329 11,615 386 47 — 18,377
Total segment operating expenses 47,611 52,976 5,561 5,077 6,280 117,505
Segment operating income (loss) 15,604 7,173 (2,268) (5,011) (6,280) 9,218
Interest expense — — — — 3,535 3,535
Equity in net income (loss) of affiliates (29) (2) — 815 — 784
Other income (expense) – net — — — — 249 249
Segment income (loss) before income taxes $ 15,575 $ 7,171 $(2,268) $ (4,196) $ (9,566) $ 6,716