AT&T Wireless 2013 Annual Report Download - page 16
Download and view the complete annual report
Please find page 16 of the 2013 AT&T Wireless annual report below. You can navigate through the pages in the report by either clicking on the pages listed below, or by using the keyword search tool below to find specific information within the annual report.-
 1
1 -
2
-
3
-
4
-
5
-
 6
6 -
 7
7 -
 8
8 -
 9
9 -
 10
10 -
 11
11 -
 12
12 -
 13
13 -
 14
14 -
 15
15 -
 16
16 -
 17
17 -
 18
18 -
 19
19 -
 20
20 -
 21
21 -
 22
22 -
 23
23 -
 24
24 -
 25
25 -
 26
26 -
27
-
28
-
29
-
30
-
31
-
32
-
33
-
34
-
35
-
36
-
37
-
38
-
39
-
40
-
41
-
42
-
43
-
44
-
45
-
46
-
47
-
48
-
49
-
50
-
51
-
52
-
53
-
54
-
55
-
56
-
57
-
58
-
59
-
60
-
61
-
62
-
63
-
64
-
65
-
66
-
67
-
68
-
69
-
70
-
71
-
72
-
73
-
74
-
75
-
76
-
77
-
78
-
79
-
80
 |
 |

Management’s Discussion and Analysis of Financial Condition and Results of Operations (continued)
Dollars in millions except per share amounts
14 | AT&T Inc.
devices on installment), and expect to launch additional
plans during 2014. While we have focused on attracting
and retaining postpaid subscribers, we have recently
increased our focus on prepaid subscribers with our
pending acquisition of Leap Wireless, which we expect
to complete by the end of first quarter 2014.
In 2013, we continued to see an increasing number of our
postpaid subscribers select smartphones rather than feature
phones, which lack general Internet access. Of our total
postpaid phone subscriber base, 76.6% (or 51.9 million
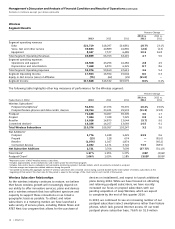
Wireless Subscriber Relationships
As the wireless industry continues to mature, we believe
that future wireless growth will increasingly depend on
our ability to offer innovative services, plans and devices
and a wireless network that has sufficient spectrum and
capacity to support these innovations on as broad a
geographic basis as possible. To attract and retain
subscribers in a maturing market, we have launched a
wide variety of service plans, including Mobile Share and
AT&T Next (our program that allows for the purchase of
Wireless
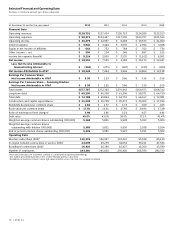
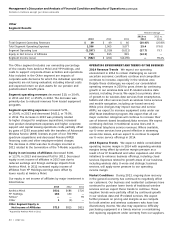
Segment Results
Percent Change
2013 vs. 2012 vs.
2013 2012 2011 2012 2011
Segment operating revenues
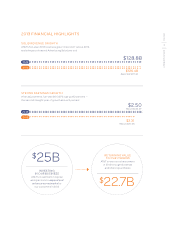
Data $21,719 $18,297 $14,861 18.7% 23.1%
Voice, text and other service 39,833 40,889 41,865 (2.6) (2.3)
Equipment 8,347 7,577 6,489 10.2 16.8
Total Segment Operating Revenues 69,899 66,763 63,215 4.7 5.6
Segment operating expenses
Operations and support 44,508 43,296 41,282 2.8 4.9
Depreciation and amortization 7,468 6,873 6,329 8.7 8.6
Total Segment Operating Expenses 51,976 50,169 47,611 3.6 5.4
Segment Operating Income 17,923 16,594 15,604 8.0 6.3
Equity in Net Income (Loss) of Affiliates (75) (62) (29) (21.0) —
Segment Income $17,848 $16,532 $15,575 8.0% 6.1%
The following table highlights other key measures of performance for the Wireless segment:
Percent Change
2013 vs. 2012 vs.
(Subscribers in 000s) 2013 2012 2011 2012 2011
Wireless Subscribers1
Postpaid smartphones2 51,874 47,076 39,376 10.2% 19.6%
Postpaid feature phones and data-centric devices 20,764 23,421 29,933 (11.3) (21.8)
Postpaid 72,638 70,497 69,309 3.0 1.7
Prepaid 7,384 7,328 7,225 0.8 1.4
Reseller 14,028 14,875 13,644 (5.7) 9.0
Connected devices3 16,326 14,257 13,069 14.5 9.1
Total Wireless Subscribers 110,376 106,957 103,247 3.2 3.6
Net Additions4
Postpaid 1,776 1,438 1,429 23.5 0.6
Prepaid (13) 128 674 — (81.0)
Reseller (1,074) 1,027 1,874 — (45.2)
Connected devices 2,032 1,171 3,722 73.5 (68.5)
Net Subscriber Additions 2,721 3,764 7,699 (27.7)% (51.1)%
Total Churn5 1.37% 1.35% 1.37% 2 BP (2) BP
Postpaid Churn5 1.06% 1.09% 1.18% (3) BP (9) BP
1 Represents 100% of AT&T Mobility wireless subscribers.
2 Includes approximately 1,534 smartphones sold in 2013 under the AT&T Next program.
3 Includes data-centric devices (eReaders and automobile monitoring systems). Excludes tablets, which are primarily included in postpaid.
4 Excludes merger and acquisition-related additions during the period.
5 Calculated by dividing the aggregate number of wireless subscribers who canceled service during a period divided by the total number of wireless subscribers at the
beginning of that period. The churn rate for the period is equal to the average of the churn rate for each month of that period.