AT&T Wireless 2011 Annual Report Download - page 93
Download and view the complete annual report
Please find page 93 of the 2011 AT&T Wireless annual report below. You can navigate through the pages in the report by either clicking on the pages listed below, or by using the keyword search tool below to find specific information within the annual report.-
 1
1 -
2
-
3
-
4
-
5
-
6
-
7
-
8
-
9
-
10
-
11
-
12
-
13
-
14
-
15
-
16
-
17
-
18
-
19
-
20
-
21
-
22
-
23
-
24
-
25
-
26
-
27
-
28
-
29
-
30
-
31
-
32
-
33
-
34
-
35
-
36
-
37
-
38
-
39
-
40
-
41
-
42
-
43
-
44
-
45
-
46
-
47
-
48
-
49
-
50
-
51
-
52
-
53
-
54
-
55
-
56
-
57
-
58
-
59
-
60
-
61
-
62
-
63
-
64
-
65
-
66
-
67
-
68
-
69
-
70
-
71
-
72
-
73
-
74
-
75
-
76
-
77
-
78
-
79
-
80
-
81
-
82
-
 83
83 -
 84
84 -
 85
85 -
 86
86 -
 87
87 -
 88
88 -
 89
89 -
 90
90 -
 91
91 -
 92
92 -
 93
93 -
 94
94 -
 95
95 -
 96
96 -
 97
97 -
 98
98 -
 99
99 -
 100
100
 |
 |

AT&T Inc. 91
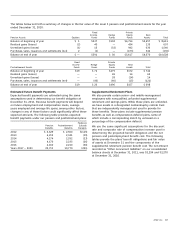
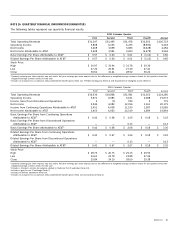
NOTE 16. QUARTERLY FINANCIAL INFORMATION (UNAUDITED)
The following tables represent our quarterly financial results:
2011 Calendar Quarter
First Second Third Fourth2 Annual
Total Operating Revenues $31,247 $31,495 $31,478 $32,503 $126,723
Operating Income 5,808 6,165 6,235 (8,990) 9,218
Net Income 3,468 3,658 3,686 (6,628) 4,184
Net Income Attributable to AT&T 3,408 3,591 3,623 (6,678) 3,944
Basic Earnings Per Share Attributable to AT&T1 $ 0.57 $ 0.60 $ 0.61 $ (1.12) $ 0.66
Diluted Earnings Per Share Attributable to AT&T1 $ 0.57 $ 0.60 $ 0.61 $ (1.12) $ 0.66
Stock Price
High $ 30.97 $ 31.94 $ 31.78 $ 30.30
Low 27.20 29.91 27.29 27.41
Close 30.61 31.41 28.52 30.24
1 Quarterly earnings per share impacts may not add to full-year earnings per share impacts due to the difference in weighted-average common shares for the quarters versus the
weighted-average common shares for the year.
2 Includes an actuarial loss on pension and postretirement benefit plans (Note 11), T-Mobile breakup fee (Note 2) and impairment of intangible assets (Note 6).
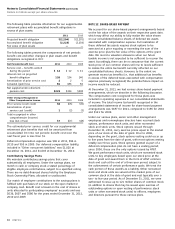
2010 Calendar Quarter
First2 Second3 Third4 Fourth5 Annual
Total Operating Revenues $30,530 $30,808 $31,581 $31,361 $124,280
Operating Income 5,971 6,083 5,431 2,088 19,573
Income (Loss) from Discontinued Operations 2 (5) 780 2 779
Net Income 2,540 4,082 12,396 1,161 20,179
Income from Continuing Operations Attributable to AT&T 2,451 4,008 11,539 1,087 19,085
Net Income Attributable to AT&T 2,453 4,003 12,319 1,089 19,864
Basic Earnings Per Share from Continuing Operations
Attributable to AT&T1 $ 0.42 $ 0.68 $ 1.95 $ 0.18 $ 3.23
Basic Earnings Per Share from Discontinued Operations
Attributable to AT&T1 — — 0.13 — 0.13
Basic Earnings Per Share Attributable to AT&T1 $ 0.42 $ 0.68 $ 2.08 $ 0.18 $ 3.36
Diluted Earnings Per Share from Continuing Operations
Attributable to AT&T1 $ 0.41 $ 0.67 $ 1.94 $ 0.18 $ 3.22
Diluted Earnings Per Share from Discontinued Operations
Attributable to AT&T1 — — 0.13 — 0.13
Diluted Earnings Per Share Attributable to AT&T1 $ 0.41 $ 0.67 $ 2.07 $ 0.18 $ 3.35
Stock Price
High $ 28.73 $ 26.75 $ 29.15 $ 29.56
Low 24.61 23.78 23.88 27.49
Close 25.84 24.19 28.60 29.38
1 Quarterly earnings per share impacts may not add to full-year earnings per share impacts due to the difference in weighted-average common shares for the quarters versus the
weighted-average common shares for the year.
2 Includes a charge to income tax expense related to Medicare Part D subsidies (Note 10).
3 Includes a gain on our TI exchange (Note 7).
4 Includes an IRS tax settlement (Note 10).
5 Includes an actuarial loss on pension and postretirement benefit plans (Note 11) and severance (Note 1).