AT&T Wireless 2011 Annual Report Download - page 50
Download and view the complete annual report
Please find page 50 of the 2011 AT&T Wireless annual report below. You can navigate through the pages in the report by either clicking on the pages listed below, or by using the keyword search tool below to find specific information within the annual report.-
 1
1 -
2
-
3
-
4
-
5
-
6
-
7
-
8
-
9
-
10
-
11
-
12
-
13
-
14
-
15
-
16
-
17
-
18
-
19
-
20
-
21
-
22
-
23
-
24
-
25
-
26
-
27
-
28
-
29
-
30
-
31
-
32
-
33
-
34
-
35
-
36
-
37
-
38
-
39
-
 40
40 -
 41
41 -
 42
42 -
 43
43 -
 44
44 -
 45
45 -
 46
46 -
 47
47 -
 48
48 -
 49
49 -
 50
50 -
 51
51 -
 52
52 -
 53
53 -
 54
54 -
 55
55 -
 56
56 -
 57
57 -
 58
58 -
 59
59 -
 60
60 -
61
-
62
-
63
-
64
-
65
-
66
-
67
-
68
-
69
-
70
-
71
-
72
-
73
-
74
-
75
-
76
-
77
-
78
-
79
-
80
-
81
-
82
-
83
-
84
-
85
-
86
-
87
-
88
-
89
-
90
-
91
-
92
-
93
-
94
-
95
-
96
-
97
-
98
-
99
-
100
 |
 |

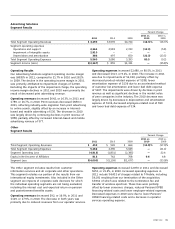
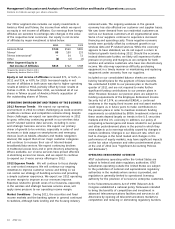
Management’s Discussion and Analysis of Financial Condition and Results of Operations (continued)
Dollars in millions except per share amounts
48 AT&T Inc.
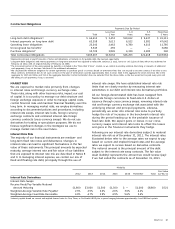
investment. We expect increases in our Wireless segment to
be offset by declines in our Wireline segment. The amount of
capital investment is influenced by demand for services and
products, continued growth and regulatory considerations.
Cash Used in or Provided by Financing Activities
We paid dividends of $10,172 in 2011, $9,916 in 2010,
and $9,670 in 2009, reflecting dividend rate increases.
In December 2011, our Board of Directors approved a 2.3%
increase in the quarterly dividend from $0.43 to $0.44 per
share. This follows a 2.4% dividend increase approved by
AT&T’s Board in December 2010. Dividends declared by our
Board of Directors totaled $1.73 per share in 2011, $1.69
per share in 2010, and $1.65 per share in 2009. Our dividend
policy considers the expectations and requirements of
stockholders, internal requirements of AT&T and long-term
growth opportunities. It is our intent to provide the financial
flexibility to allow our Board of Directors to consider dividend
growth and to recommend an increase in dividends to be paid
in future periods. All dividends remain subject to declaration
by our Board of Directors.
During 2011, we issued debt with net proceeds of $7,936
from the following:
•April2011issuanceof$1,750of2.95%globalnotes
due 2016 and $1,250 of 4.45% global notes due 2021.
•August2011issuanceof$1,500of2.40%globalnotes
due 2016, $1,500 of 3.875% global notes due 2021,
and $2,000 of 5.55% global notes due 2041.
Debt proceeds were used for general corporate purposes.
During 2011, debt repayments totaled $9,226 and consisted of:
•$4,543inrepaymentsoflong-termdebtwithaweighted-
average interest rate of 6.58%.
•$1,625inrepaymentsofcommercialpaper,netof
issuances.
•$1,000fortheearlyredemptionoftheSBC
Communications Inc. 5.875% global notes originally due
on February 1, 2012.
•$2,000fortheearlyredemptionoftheNewCingular
Wireless Services, Inc. 8.125% notes originally due on
May 1, 2012.
•$31inrepaymentsofcapitalizedleases.
•$27inrepaymentsofshort-termbankborrowings.
At December 31, 2011, we had $3,453 of debt maturing
within one year, all of which was long-term debt maturities.
Debt maturing within one year includes the following notes
that may be put back to us by the holders:
•$1,000ofannualputresetsecuritiesissuedbyBellSouth
that may be put back to us each April until maturity in
2021.
•Anaccretingzero-couponnotethatmayberedeemed
each May until maturity in 2022. If the zero-coupon note
(issued for principal of $500 in 2007) is held to maturity,
the redemption amount will be $1,030.
On February 13, 2012, we issued $1,000 of 0.875% global
notes due 2015, $1,000 of 1.60% global notes due 2017,
and $1,000 of 3.00% global notes due 2022.
$3,000 of bonds originally due in 2012; cash payments related
to the abandoned T-Mobile acquisition; and a contribution
to our pension plan. We discuss many of these factors in
detail below.
Cash Provided by or Used in Operating Activities
During 2011, cash provided by operating activities was
$34,648, compared to $34,993 in 2010. Our lower operating
cash flows reflected the payment of $3,000 cash to Deutsche
Telekom and a contribution to the pension plan of $1,000
partially offset by decreased tax payments of $3,506.
Current-year operating cash was also positively affected
by our decision to pay approximately $2,500 of retiree
postretirement expenses from plan assets, as opposed to
our prior-year election to pay these out of corporate funds.
During 2010, cash provided by operating activities was
$34,993 compared to $34,405 in 2009. Our higher operating
cash flow reflected decreased tax payments of $933.
During 2010, our payments for current income taxes were
lower than 2009 due to lower audit-related payments net
of refunds. The timing of cash payments for income taxes
is governed by the IRS and other taxing authorities and
differs from the timing of recording tax expense.
Cash Used in or Provided by Investing Activities
During 2011, cash used in investing activities consisted
primarily of:
•$20,110incapitalexpenditures,excludinginterestduring
construction.
•$162ininterestduringconstruction.
•$1,925purchaseofQualcommspectrumlicenses.
•$320purchaseofwirelesspartnershipnoncontrolling
interest.
During 2011, cash provided by investing activities consisted
primarily of:
•$1,197fromthetenderofourTelmexshares.
•$62fromthesaleofsecurities,netofinvestments.
Virtually all of our capital expenditures are spent on our
wireless and wireline networks, our U-verse services and
support systems for our communications services. Capital
expenditures, excluding interest during construction, increased
$580 from 2010 and were flat when including interest during
construction. The Wireline segment, which includes U-verse
services, represented 52% of the total capital expenditures,
excluding interest during construction, and was flat in 2011.
Capital spending in our Wireless segment, excluding capitalized
interest during construction, represented 48% of our total
spending and increased 6% in 2011. Wireless expenditures
were primarily used for network capacity expansion,
integration and upgrades to our High-Speed Downlink
Packet Access network and the initial deployment of LTE
equipment for our recent commercial launch.
We expect that our capital expenditures during 2012 will
be approximately $20,000. This amount may change if the
regulatory environment becomes more unfavorable for