AT&T Wireless 2011 Annual Report Download - page 84
Download and view the complete annual report
Please find page 84 of the 2011 AT&T Wireless annual report below. You can navigate through the pages in the report by either clicking on the pages listed below, or by using the keyword search tool below to find specific information within the annual report.-
 1
1 -
2
-
3
-
4
-
5
-
6
-
7
-
8
-
9
-
10
-
11
-
12
-
13
-
14
-
15
-
16
-
17
-
18
-
19
-
20
-
21
-
22
-
23
-
24
-
25
-
26
-
27
-
28
-
29
-
30
-
31
-
32
-
33
-
34
-
35
-
36
-
37
-
38
-
39
-
40
-
41
-
42
-
43
-
44
-
45
-
46
-
47
-
48
-
49
-
50
-
51
-
52
-
53
-
54
-
55
-
56
-
57
-
58
-
59
-
60
-
61
-
62
-
63
-
64
-
65
-
66
-
67
-
68
-
69
-
70
-
71
-
72
-
73
-
 74
74 -
 75
75 -
 76
76 -
 77
77 -
 78
78 -
 79
79 -
 80
80 -
 81
81 -
 82
82 -
 83
83 -
 84
84 -
 85
85 -
 86
86 -
 87
87 -
 88
88 -
 89
89 -
 90
90 -
 91
91 -
 92
92 -
 93
93 -
 94
94 -
95
-
96
-
97
-
98
-
99
-
100
 |
 |

Notes to Consolidated Financial Statements (continued)
Dollars in millions except per share amounts
82 AT&T Inc.
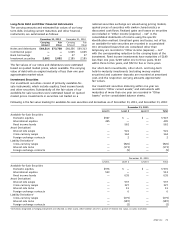
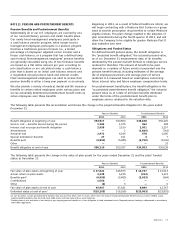
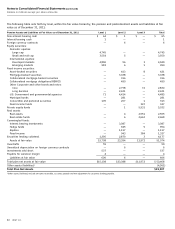
The following table sets forth by level, within the fair value hierarchy, the pension and postretirement assets and liabilities at fair
value as of December 31, 2011:
Pension Assets and Liabilities at Fair Value as of December 31, 2011 Level 1 Level 2 Level 3 Total
Non-interest bearing cash $ 64 $ 1 $ — $ 65
Interest bearing cash 1 — — 1
Foreign currency contracts — 6 — 6
Equity securities:
Domestic equities:
Large cap 4,745 — — 4,745
Small and mid cap 3,554 5 — 3,559
International equities:
Developed markets 4,890 56 3 4,949
Emerging markets 983 6 1 990
Fixed income securities:
Asset-backed securities — 413 8 421
Mortgage-backed securities — 3,038 — 3,038
Collateralized mortgage-backed securities — 316 — 316
Collateralized mortgage obligations/REMICS — 490 — 490
Other Corporate and other bonds and notes:
Core — 2,758 72 2,830
Long duration — 2,421 — 2,421
U.S. Government and governmental agencies 71 4,414 — 4,485
Municipal bonds — 281 — 281
Convertible and preferred securities 105 207 1 313
Fixed income funds — — 347 347
Private equity funds — 1 5,931 5,932
Real assets:
Real assets — 4 2,551 2,555
Real estate funds — 6 2,662 2,668
Commingled funds:
Interest bearing investments — 3,087 — 3,087
Hedge funds — 945 9 954
Equities — 1,117 — 1,117
Fixed income — 943 384 1,327
Securities lending collateral 1,295 2,879 3 4,177
Assets at fair value 15,708 23,394 11,972 51,074
Overdrafts 59 — — 59
Unrealized depreciation on foreign currency contracts — 6 — 6
Investments sold short 537 — — 537
Payable for variation margin 4 — — 4
Liabilities at fair value 600 6 — 606
Total plan net assets at fair value $15,108 $23,388 $11,972 $ 50,468
Other assets (liabilities)1 (4,561)
Total Plan Net Assets $45,907
1 Other assets (liabilities) include amounts receivable, accounts payable and net adjustment for securities lending payable.