AT&T Wireless 2011 Annual Report Download - page 39
Download and view the complete annual report
Please find page 39 of the 2011 AT&T Wireless annual report below. You can navigate through the pages in the report by either clicking on the pages listed below, or by using the keyword search tool below to find specific information within the annual report.-
 1
1 -
2
-
3
-
4
-
5
-
6
-
7
-
8
-
9
-
10
-
11
-
12
-
13
-
14
-
15
-
16
-
17
-
18
-
19
-
20
-
21
-
22
-
23
-
24
-
25
-
26
-
27
-
28
-
 29
29 -
 30
30 -
 31
31 -
 32
32 -
 33
33 -
 34
34 -
 35
35 -
 36
36 -
 37
37 -
 38
38 -
 39
39 -
 40
40 -
 41
41 -
 42
42 -
 43
43 -
 44
44 -
 45
45 -
 46
46 -
 47
47 -
 48
48 -
 49
49 -
50
-
51
-
52
-
53
-
54
-
55
-
56
-
57
-
58
-
59
-
60
-
61
-
62
-
63
-
64
-
65
-
66
-
67
-
68
-
69
-
70
-
71
-
72
-
73
-
74
-
75
-
76
-
77
-
78
-
79
-
80
-
81
-
82
-
83
-
84
-
85
-
86
-
87
-
88
-
89
-
90
-
91
-
92
-
93
-
94
-
95
-
96
-
97
-
98
-
99
-
100
 |
 |

AT&T Inc. 37
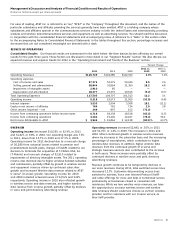
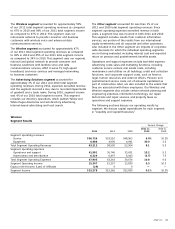
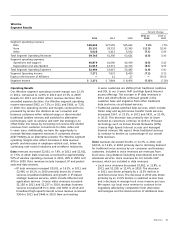
Wireline
Segment Results
Percent Change
2011 vs. 2010 vs.
2011 2010 2009 2010 2009
Segment operating revenues
Data $29,606 $27,555 $25,644 7.4% 7.5%
Voice 25,131 28,332 32,345 (11.3) (12.4)
Other 5,028 5,413 5,632 (7.1) (3.9)
Total Segment Operating Revenues 59,765 61,300 63,621 (2.5) (3.6)
Segment operating expenses
Operations and support 40,879 41,096 42,439 (0.5) (3.2)
Depreciation and amortization 11,615 12,371 12,743 (6.1) (2.9)
Total Segment Operating Expenses 52,494 53,467 55,182 (1.8) (3.1)
Segment Operating Income 7,271 7,833 8,439 (7.2) (7.2)
Equity in Net Income of Affiliates — 11 17 — (35.3)
Segment Income $ 7,271 $ 7,844 $ 8,456 (7.3)% (7.2)%
U-verse customers are shifting from traditional landlines
and DSL to our U-verse VoIP and High Speed Internet
access offerings. The increase in IP data revenues in
2011 and 2010 reflects continued growth in the
customer base and migration from other traditional
data and voice circuit-based services.
•Traditionalpacket-switcheddataservices,whichinclude
frame relay and asynchronous transfer mode services,
decreased $367, or 23.2%, in 2011 and $431, or 21.4%,
in 2010. This decrease was primarily due to lower
demand as customers continue to shift to IP-based
technology such as Virtual Private Networks (VPN),
U-verse High Speed Internet access and managed
Internet services. We expect these traditional services
to continue to decline as a percentage of our overall
data revenues.
Voice revenues decreased $3,201, or 11.3%, in 2011 and
$4,013, or 12.4%, in 2010 primarily due to declining demand
for traditional voice services by our consumer and business
customers. Included in voice revenues are revenues from
local voice, long distance (including international) and local
wholesale services. Voice revenues do not include VoIP
revenues, which are included in data revenues.
•Localvoicerevenuesdecreased$2,061,or11.8%,in
2011 and $2,258, or 11.4%, in 2010. The decrease
in 2011 was driven primarily by a 12.3% decline in
switched access lines. The decrease in 2010 was driven
primarily by an 11.9% decline in switched access lines
and a decrease in average local voice revenue per user.
We expect our local voice revenue to continue to be
negatively affected by competition from alternative
technologies and the disconnection of additional lines.
Operating Results
Our Wireline segment operating income margin was 12.2%
in 2011, compared to 12.8% in 2010 and 13.3% in 2009.
Results for 2011 and 2010 reflect revenue declines that
exceeded expense declines. Our Wireline segment operating
income decreased $562, or 7.2%, in 2011 and $606, or 7.2%,
in 2010. Our operating income and margins continued to be
pressured by access line declines as our consumer and
business customers either reduced usage or disconnected
traditional landline services and switched to alternative
technologies, such as wireless and VoIP. Our strategy is to
offset these line losses by increasing non-access-line-related
revenues from customer connections for data, video and
U-verse voice. Additionally, we have the opportunity to
increase Wireless segment revenues if customers choose
AT&T Mobility as an alternative provider. The Wireline segment
operating margins also reflect increases in data revenue
growth and decreases in employee-related cost, driven by
continuing cost-control initiatives and workforce reductions.
Data revenues increased $2,051, or 7.4%, in 2011 and $1,911,
or 7.5%, in 2010. Data revenues accounted for approximately
50% of wireline operating revenues in 2011, 45% in 2010 and
40% in 2009. Data revenues include transport, IP and packet-
switched data services.
•IPdatarevenuesincreased$2,502,or16.1%,in2011and
$2,495, or 19.1%, in 2010 primarily driven by U-verse
services, broadband additions and growth in IP-based
strategic business services, which include Ethernet and
application services. U-verse video revenues increased
$1,150 in 2011 and $1,227 in 2010, strategic business
services increased $873 in 2011 and $650 in 2010 and
broadband high-speed Internet access revenue increased
$364 in 2011 and $446 in 2010. New and existing