AT&T Wireless 2011 Annual Report Download - page 41
Download and view the complete annual report
Please find page 41 of the 2011 AT&T Wireless annual report below. You can navigate through the pages in the report by either clicking on the pages listed below, or by using the keyword search tool below to find specific information within the annual report.-
 1
1 -
2
-
3
-
4
-
5
-
6
-
7
-
8
-
9
-
10
-
11
-
12
-
13
-
14
-
15
-
16
-
17
-
18
-
19
-
20
-
21
-
22
-
23
-
24
-
25
-
26
-
27
-
28
-
29
-
30
-
 31
31 -
 32
32 -
 33
33 -
 34
34 -
 35
35 -
 36
36 -
 37
37 -
 38
38 -
 39
39 -
 40
40 -
 41
41 -
 42
42 -
 43
43 -
 44
44 -
 45
45 -
 46
46 -
 47
47 -
 48
48 -
 49
49 -
 50
50 -
 51
51 -
52
-
53
-
54
-
55
-
56
-
57
-
58
-
59
-
60
-
61
-
62
-
63
-
64
-
65
-
66
-
67
-
68
-
69
-
70
-
71
-
72
-
73
-
74
-
75
-
76
-
77
-
78
-
79
-
80
-
81
-
82
-
83
-
84
-
85
-
86
-
87
-
88
-
89
-
90
-
91
-
92
-
93
-
94
-
95
-
96
-
97
-
98
-
99
-
100
 |
 |

AT&T Inc. 39
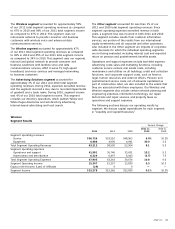
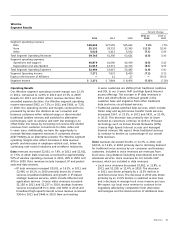
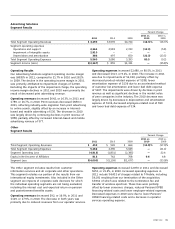
Advertising Solutions
Segment Results
Percent Change
2011 vs. 2010 vs.
2011 2010 2009 2010 2009
Total Segment Operating Revenues $ 3,293 $3,935 $4,724 (16.3)% (16.7)%
Segment operating expenses
Operations and support 2,264 2,583 2,743 (12.3) (5.8)
Impairment of intangible assets 2,910 — — — —
Depreciation and amortization 386 497 650 (22.3) (23.5)
Total Segment Operating Expenses 5,560 3,080 3,393 80.5 (9.2)
Segment Income (Loss) $(2,267) $ 855 $1,331 — (35.8)%
Operating expenses increased $2,480, or 80.5%, in 2011
and decreased $313, or 9.2%, in 2010. The increase in 2011
was due to impairments of $2,910, partially offset by
decreased product-related expense of $188, lower
amortization expense of $136 due to an accelerated method
of customer list amortization and lower bad debt expense
of $107. The impairments were driven by declines in print
revenue as well as significant declines in the market value
of peer companies in the industry. The 2010 decrease was
largely driven by decreases in depreciation and amortization
expense of $136, decreased employee-related cost of $99
and lower bad debt expense of $34.
Operating Results
Our Advertising Solutions segment operating income margin
was (68.8)% in 2011, compared to 21.7% in 2010 and 28.2%
in 2009. The decline in the operating income margin in 2011
was primarily attributed to impairment charges of $2,910.
Excluding the impacts of the impairment charge, the operating
income margin declines in 2011 and 2010 were primarily the
result of decreased print advertising revenue.
Operating revenues decreased $642, or 16.3%, in 2011 and
$789, or 16.7%, in 2010. Print revenues decreased $680 in
2011, reflecting industry-wide migration from print advertising
to online search, slightly offset by an increase in Internet-
based and mobile advertising of $30. The decrease in 2010
was largely driven by continuing declines in print revenue of
$858, partially offset by increased Internet-based and mobile
advertising revenue of $77.
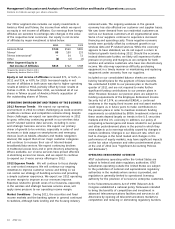
Other
Segment Results
Percent Change
2011 vs. 2010 vs.
2011 2010 2009 2010 2009
Total Segment Operating Revenues $ 453 $ 545 $ 664 (16.9)% (17.9)%
Total Segment Operating Expenses 5,266 2,396 3,049 — (21.4)
Segment Operating Loss (4,813) (1,851) (2,385) — 22.4
Equity in Net Income of Affiliates 813 742 708 9.6 4.8
Segment Loss $(4,000) $(1,109) $(1,677) — (33.9)%
Operating expenses increased $2,870 in 2011 and decreased
$653, or 21.4%, in 2010. Increased operating expenses in
2011 include $4,432 of charges related to T-Mobile, including
$4,181 resulting from our termination of the acquisition,
$3,962 of which was related to the termination fee and
transfer of wireless spectrum. These fees were partially
offset by lower severance charges, reduced Pension/OPEB
financing-related costs and lower employee-related expenses.
Decreased expenses in 2010 were due to lower Pension/
OPEB financing-related costs and a decrease in operator
services operating expense.
The Other segment includes results from customer
information services and all corporate and other operations.
This segment includes our portion of the results from our
international equity investments. Also included in the Other
segment are impacts of corporate-wide decisions for which
the individual operating segments are not being evaluated,
including the interest cost and expected return on pension
and postretirement benefits assets.
Operating revenues decreased $92, or 16.9%, in 2011 and
$119, or 17.9%, in 2010. The decrease in both years was
primarily due to reduced revenues from our operator services.