AT&T Wireless 2011 Annual Report Download - page 34
Download and view the complete annual report
Please find page 34 of the 2011 AT&T Wireless annual report below. You can navigate through the pages in the report by either clicking on the pages listed below, or by using the keyword search tool below to find specific information within the annual report.-
 1
1 -
2
-
3
-
4
-
5
-
6
-
7
-
8
-
9
-
10
-
11
-
12
-
13
-
14
-
15
-
16
-
17
-
18
-
19
-
20
-
21
-
22
-
23
-
 24
24 -
 25
25 -
 26
26 -
 27
27 -
 28
28 -
 29
29 -
 30
30 -
 31
31 -
 32
32 -
 33
33 -
 34
34 -
 35
35 -
 36
36 -
 37
37 -
 38
38 -
 39
39 -
 40
40 -
 41
41 -
 42
42 -
 43
43 -
 44
44 -
45
-
46
-
47
-
48
-
49
-
50
-
51
-
52
-
53
-
54
-
55
-
56
-
57
-
58
-
59
-
60
-
61
-
62
-
63
-
64
-
65
-
66
-
67
-
68
-
69
-
70
-
71
-
72
-
73
-
74
-
75
-
76
-
77
-
78
-
79
-
80
-
81
-
82
-
83
-
84
-
85
-
86
-
87
-
88
-
89
-
90
-
91
-
92
-
93
-
94
-
95
-
96
-
97
-
98
-
99
-
100
 |
 |

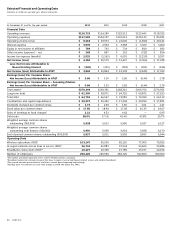
Management’s Discussion and Analysis of Financial Condition and Results of Operations (continued)
Dollars in millions except per share amounts
32 AT&T Inc.
Cost of services and sales expenses increased $4,995, or
9.5%, in 2011 and $1,740, or 3.4%, in 2010. Excluding the
increase of $1,668 related to the actuarial loss, expense
increases in 2011 were primarily due to higher wireless handset
costs related to strong smartphone sales, partially offset by
lower financing-related costs associated with our pension and
postretirement benefits (referred to as Pension/OPEB expenses)
and other employee-related expenses. Excluding the increase
of more than $700 in expense related to the actuarial loss,
expense increases in 2010 were primarily due to higher
smartphone handset costs, higher interconnect and network
system costs, and higher Universal Service Fund (USF) costs,
partially offset by lower Pension/OPEB financing costs and
other employee-related expenses.
Selling, general and administrative expenses increased
$5,980, or 18.2%, in 2011 and $1,505, or 4.8%, in 2010.
The 2011 expenses increased by $2,091 related to the
actuarial loss, $4,181 associated with T-Mobile and higher
commissions paid on smartphone sales, slightly offset by
lower severance accruals, Pension/OPEB financing costs and
other employee-related charges. Expenses for 2010 increased
$1,600 related to the actuarial loss, as well as increases in
advertising and various support expenses, mostly offset by
lower bad debt expense, Pension/OPEB financing costs
and other employee-related expenses.
Impairment of intangible assets In 2011, we recorded
noncash charges for impairments in our Advertising Solutions
segment, which consisted of a $2,745 goodwill impairment
and a $165 impairment of a trade name. The 2010
impairment of $85 was for the impairment of a trade name.
Depreciation and amortization expense decreased $1,002,
or 5.2%, in 2011 and $136, or 0.7%, in 2010. The decreases
in 2011 and 2010 were primarily due to lower amortization
of intangibles for customer lists related to acquisitions.
Interest expense increased $541, or 18.1%, in 2011 and
decreased $374, or 11.1%, in 2010. The increase in interest
expense for 2011 was primarily due to no longer
capitalizing interest on certain spectrum that will be used
to support our Long Term Evolution (LTE) technology,
partially offset by a decrease in our average debt balances.
Effective January 1, 2011, we ceased capitalization of
interest on certain spectrum for LTE as this spectrum was
determined to be ready for its intended use.
The decline in interest expense for 2010 was primarily due
to a decrease in our average debt balances, along with a
decrease in our weighted-average interest rate.
Equity in net income of affiliates increased $22, or 2.9%,
in 2011 and $28, or 3.8%, in 2010. Increased equity in net
income of affiliates in 2011 was due to improved operating
results at América Móvil, S.A. de C.V. (América Móvil), partially
offset by lower results from Télefonos de México, S.A. de C.V.
(Telmex). The 2010 increase was due to improved results at
América Móvil.
Other income (expense) – net We had other income of
$249 in 2011, $897 in 2010 and $152 in 2009. Results for
2011 included $97 of net gains from the sale of investments,
$80 of leveraged lease income and $73 of interest and
dividend income.
Other income for 2010 included a $658 gain on the exchange
of Telmex Internacional, S.A.B. de C.V. (Telmex Internacional)
shares for América Móvil shares, $197 due to gains on the
sale of investments, $71 of interest and dividend income
and $66 of leveraged lease income, partially offset by $98
of investment impairments. Results for 2009 included gains
of $154 on the sale of investments, $77 of interest and
dividend income and leveraged lease income of $41, partially
offset by $102 of investment impairments.
Income tax expense increased $3,694 in 2011 and decreased
$7,253 in 2010. The increase in income tax in 2011 is
primarily due to a settlement with the Internal Revenue
Service (IRS) that occurred in the third quarter of 2010 related
to a restructuring of our wireless operations, which lowered
our income taxes in 2010 by $8,300. The tax benefit of the
IRS settlement was partially offset by a $995 charge to
income tax expense recorded during the first quarter of 2010
to reflect the deferred tax impact of enacted U.S. healthcare
legislation and by lower income before income taxes during
2011 (see Note 10). Our effective tax rate in 2011 was 37.7%,
compared to (6.4)% in 2010 and 32.9% in 2009.
Income from discontinued operations, net of tax In the
third quarter of 2010, we sold our subsidiary Sterling
Commerce Inc. (Sterling). Income from discontinued
operations in 2010 was $779, including a gain of $769.
Income from discontinued operations in 2009 was $20.
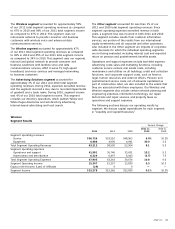
Segment Results
Our segments are strategic business units that offer different
products and services over various technology platforms and
are managed accordingly. Our operating segment results
presented in Note 4 and discussed below for each segment
follow our internal management reporting. We analyze our
various operating segments based on segment income before
income taxes. We make our capital allocations decisions
based on our strategic direction of the business, needs of
the network (wireless or wireline) providing services and
other assets needed to provide emerging services to our
customers. Actuarial gains and losses from pension and other
postretirement benefits, interest expense and other income
(expense) – net, are managed only on a total company basis
and are, accordingly, reflected only in consolidated results.
Therefore, these items are not included in the calculation
of each segment’s percentage of our total segment income.
Each segment’s percentage of total segment operating
revenue and income calculations is derived from our segment
results table in Note 4, and income percentage may total
more than 100 percent due to losses in one or more
segments. We have four reportable segments: (1) Wireless,
(2) Wireline, (3) Advertising Solutions and (4) Other.