AT&T Wireless 2011 Annual Report Download - page 28
Download and view the complete annual report
Please find page 28 of the 2011 AT&T Wireless annual report below. You can navigate through the pages in the report by either clicking on the pages listed below, or by using the keyword search tool below to find specific information within the annual report.-
 1
1 -
2
-
3
-
4
-
5
-
6
-
7
-
8
-
9
-
10
-
11
-
12
-
13
-
14
-
15
-
16
-
17
-
 18
18 -
 19
19 -
 20
20 -
 21
21 -
 22
22 -
 23
23 -
 24
24 -
 25
25 -
 26
26 -
 27
27 -
 28
28 -
 29
29 -
 30
30 -
 31
31 -
 32
32 -
 33
33 -
 34
34 -
 35
35 -
 36
36 -
 37
37 -
 38
38 -
39
-
40
-
41
-
42
-
43
-
44
-
45
-
46
-
47
-
48
-
49
-
50
-
51
-
52
-
53
-
54
-
55
-
56
-
57
-
58
-
59
-
60
-
61
-
62
-
63
-
64
-
65
-
66
-
67
-
68
-
69
-
70
-
71
-
72
-
73
-
74
-
75
-
76
-
77
-
78
-
79
-
80
-
81
-
82
-
83
-
84
-
85
-
86
-
87
-
88
-
89
-
90
-
91
-
92
-
93
-
94
-
95
-
96
-
97
-
98
-
99
-
100
 |
 |

26 AT&T Inc.
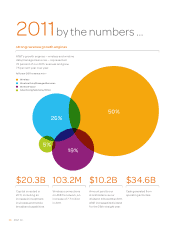
2011by the numbers …
strong revenue growth engines
AT&T’s growth engines — wireless and wireline
data/managed services — represented
76 percent of our 2011 revenues and grew
7.5 percent year over year.
full-year 2011 revenue mix >
50%
19%
26%
5%
Wireless
Wireline Voice
Advertising Solutions/Other
Wireline Data/Managed Services
$20.3B
Capital invested in
2011, including an
increase in investment
in wireless and mobile
broadband capabilities.
103.2M
Wireless connections
on AT&T’s network, an
increase of 7.7 million
in 2011.
$10.2B
Amount paid to our
stockholders via our
dividend. In December 2011,
AT&T increased its dividend
for the 28th straight year.
$34.6B
Cash generated from
operating activities.