AT&T Wireless 2011 Annual Report Download - page 81
Download and view the complete annual report
Please find page 81 of the 2011 AT&T Wireless annual report below. You can navigate through the pages in the report by either clicking on the pages listed below, or by using the keyword search tool below to find specific information within the annual report.-
 1
1 -
2
-
3
-
4
-
5
-
6
-
7
-
8
-
9
-
10
-
11
-
12
-
13
-
14
-
15
-
16
-
17
-
18
-
19
-
20
-
21
-
22
-
23
-
24
-
25
-
26
-
27
-
28
-
29
-
30
-
31
-
32
-
33
-
34
-
35
-
36
-
37
-
38
-
39
-
40
-
41
-
42
-
43
-
44
-
45
-
46
-
47
-
48
-
49
-
50
-
51
-
52
-
53
-
54
-
55
-
56
-
57
-
58
-
59
-
60
-
61
-
62
-
63
-
64
-
65
-
66
-
67
-
68
-
69
-
70
-
 71
71 -
 72
72 -
 73
73 -
 74
74 -
 75
75 -
 76
76 -
 77
77 -
 78
78 -
 79
79 -
 80
80 -
 81
81 -
 82
82 -
 83
83 -
 84
84 -
 85
85 -
 86
86 -
 87
87 -
 88
88 -
 89
89 -
 90
90 -
 91
91 -
92
-
93
-
94
-
95
-
96
-
97
-
98
-
99
-
100
 |
 |

AT&T Inc. 79
denominated in U.S. dollars, and neither callable, convertible
nor index linked. For the year ended December 31, 2011, we
decreased our discount rate by 0.50%, resulting in an increase
in our pension plan benefit obligation of $3,384 and an
increase in our postretirement benefit obligation of $2,114.
For the year ended December 31, 2010, we decreased our
discount rate by 0.70%, resulting in an increase in our pension
plan benefit obligation of $3,995 and an increase in our
postretirement benefit obligation of $2,817.
Expected Long-Term Rate of Return Our expected long-term
rate of return on plan assets of 8.25% for 2012 and 2011
reflects the average rate of earnings expected on the funds
invested, or to be invested, to provide for the benefits
included in the projected benefit obligations. In setting the
long-term assumed rate of return, management considers
capital markets future expectations and the asset mix of the
plans’ investments. Actual long-term return can, in relatively
stable markets, also serve as a factor in determining future
expectations. We consider many factors that include, but are
not limited to, historical returns on plan assets, current market
information on long-term returns (e.g., long-term bond rates)
and current and target asset allocations between asset
categories. The target asset allocation is determined based on
consultations with external investment advisers. If all other
factors were to remain unchanged, we expect that a 1.00%
decrease in the actual long-term rate of return would cause
2012 combined pension and postretirement cost to increase
$525. However, any differences in the rate and actual returns
will be included with the actuarial gain or loss recorded in the
fourth quarter when our plans are remeasured. In 2012, we
have decided to maintain 8.25% for our expected long-term
rate of return, based on future market performance and lower
economic growth in the near term.
Composite Rate of Compensation Increase Our expected
composite rate of compensation increase of 4.00% reflects
the long-term average rate of salary increases.
Healthcare Cost Trend Our healthcare cost trend
assumptions are developed based on historical cost data, the
near-term outlook and an assessment of likely long-term
trends. In addition to the healthcare cost trend, we assume
an annual 3.00% growth in administrative expenses and an
annual 3.00% growth in dental claims. Due to benefit design
changes (e.g., increased copays and deductibles for
prescription drugs and certain medical services), we have
generally experienced better-than-expected claims cost in
recent years, resulting in an actuarial gain of $1,432 in 2011
and $1,263 in 2010. Our assumed annual healthcare cost
trend rate for 2012 and 2011 is 5.00%.
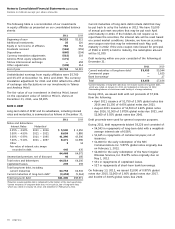
The estimated prior service credits that will be amortized from
accumulated OCI into net periodic benefit cost over the next
fiscal year is $15 for pension and $846 for postretirement
benefits.
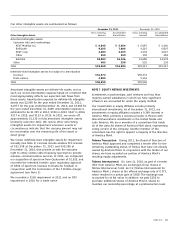
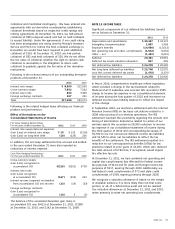
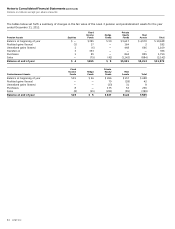
Assumptions
In determining the projected benefit obligation and the net
pension and postemployment benefit cost, we used the
following significant weighted-average assumptions:
2011 2010 2009
Discount rate for determining
projected benefit obligation
at December 31 5.30% 5.80% 6.50%
Discount rate in effect for
determining net cost 5.80% 6.50% 7.00%
Long-term rate of return
on plan assets 8.25% 8.50% 8.50%
Composite rate of compensation
increase for determining
projected benefit obligation
and net pension cost (benefit) 4.00% 4.00% 4.00%
Uncertainty in the securities markets and U.S. economy
could result in investment returns less than those assumed.
Should the securities markets decline or medical and
prescription drug costs increase at a rate greater than
assumed, we would expect increasing annual combined net
pension and postretirement costs for the next several years.
Should actual experience differ from actuarial assumptions,
the projected pension benefit obligation and net pension
cost and accumulated postretirement benefit obligation and
postretirement benefit cost would be affected in future years.
Our expected return on plan assets is calculated using the
actual fair value of plan assets. We recognize actual gains and
losses on pension and postretirement plan assets immediately
in our operating results. These gains and losses are measured
annually as of December 31 and accordingly will be recorded
during the fourth quarter, unless earlier remeasurements are
required.
Discount Rate Our assumed discount rate of 5.30% at
December 31, 2011, reflects the hypothetical rate at which
the projected benefit obligations could be effectively settled
or paid out to participants. We determined our discount rate
based on a range of factors, including a yield curve composed
of the rates of return on several hundred high-quality, fixed
income corporate bonds available at the measurement date
and the related expected duration for the obligations.
These bonds were all rated at least Aa3 or AA- by one of
the nationally recognized statistical rating organizations,