AT&T Wireless 2011 Annual Report Download - page 82
Download and view the complete annual report
Please find page 82 of the 2011 AT&T Wireless annual report below. You can navigate through the pages in the report by either clicking on the pages listed below, or by using the keyword search tool below to find specific information within the annual report.-
 1
1 -
2
-
3
-
4
-
5
-
6
-
7
-
8
-
9
-
10
-
11
-
12
-
13
-
14
-
15
-
16
-
17
-
18
-
19
-
20
-
21
-
22
-
23
-
24
-
25
-
26
-
27
-
28
-
29
-
30
-
31
-
32
-
33
-
34
-
35
-
36
-
37
-
38
-
39
-
40
-
41
-
42
-
43
-
44
-
45
-
46
-
47
-
48
-
49
-
50
-
51
-
52
-
53
-
54
-
55
-
56
-
57
-
58
-
59
-
60
-
61
-
62
-
63
-
64
-
65
-
66
-
67
-
68
-
69
-
70
-
71
-
 72
72 -
 73
73 -
 74
74 -
 75
75 -
 76
76 -
 77
77 -
 78
78 -
 79
79 -
 80
80 -
 81
81 -
 82
82 -
 83
83 -
 84
84 -
 85
85 -
 86
86 -
 87
87 -
 88
88 -
 89
89 -
 90
90 -
 91
91 -
 92
92 -
93
-
94
-
95
-
96
-
97
-
98
-
99
-
100
 |
 |

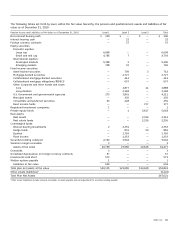
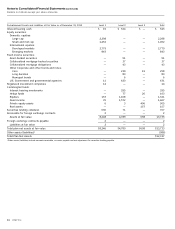
Notes to Consolidated Financial Statements (continued)
Dollars in millions except per share amounts
80 AT&T Inc.
The principal investment objectives are to ensure the availability
of funds to pay pension and postretirement benefits as they
become due under a broad range of future economic scenarios,
to maximize long-term investment return with an acceptable level
of risk based on our pension and postretirement obligations, and
to be broadly diversified across and within the capital markets to
insulate asset values against adverse experience in any one
market. Each asset class has broadly diversified characteristics.
Substantial biases toward any particular investing style or type of
security are sought to be avoided by managing the aggregation
of all accounts with portfolio benchmarks. Asset and benefit
obligation forecasting studies are conducted periodically,
generally every two to three years, or when significant changes
have occurred in market conditions, benefits, participant
demographics or funded status. Decisions regarding investment
policy are made with an understanding of the effect of asset
allocation on funded status, future contributions and projected
expenses. The current asset allocation policy and risk level for the
pension plan and VEBA assets are based on a study completed
and approved during 2011.
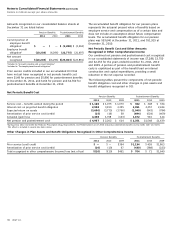
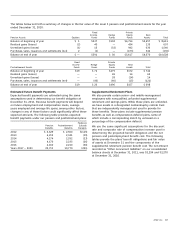
The plans’ weighted-average asset targets and actual
allocations as a percentage of plan assets, including the
notional exposure of future contracts by asset categories
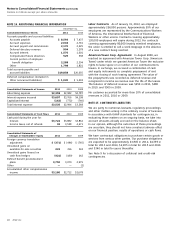
at December 31, are as follows:
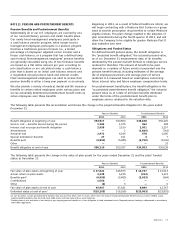
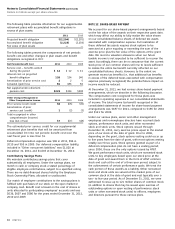
A one percentage-point change in the assumed combined
medical and dental cost trend rate would have the following
effects:
One Percentage- One Percentage-
Point Increase Point Decrease
Increase (decrease) in total of
service and interest cost components $ 303 $ (243)
Increase (decrease) in accumulated
postretirement benefit obligation 3,383 (2,788)
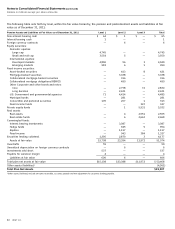
Plan Assets
Plan assets consist primarily of private and public equity,
government and corporate bonds, and real assets (real estate
and natural resources). The asset allocations of the pension
plans are maintained to meet ERISA requirements. Any plan
contributions, as determined by ERISA regulations, are made
to a pension trust for the benefit of plan participants.
Our required contributions to our pension plan for 2012
are not considered significant. We maintain VEBA trusts to
partially fund postretirement benefits; however, there are no
ERISA or regulatory requirements that these postretirement
benefit plans be funded annually.
Pension Assets Postretirement (VEBA) Assets
Target 2011 2010 Target 2011 2010
Equity securities:
Domestic 25% – 35% 24% 29% 34% – 44% 39% 42%
International 10% – 20% 15 15 26% – 36% 31 34
Fixed income securities 30% – 40% 34 34 16% – 26% 21 14
Real assets 6% – 16% 11 9 0% – 6% 1 1
Private equity 4% – 14% 13 12 0% – 10% 5 4
Other 0% – 5% 3 1 0% – 8% 3 5
Total 100% 100% 100% 100%
At December 31, 2011, AT&T securities represented less than 0.5% of assets held by our pension plans and less than 1.5% of
assets held by our VEBA trusts.