AT&T Wireless 2011 Annual Report Download - page 36
Download and view the complete annual report
Please find page 36 of the 2011 AT&T Wireless annual report below. You can navigate through the pages in the report by either clicking on the pages listed below, or by using the keyword search tool below to find specific information within the annual report.-
 1
1 -
2
-
3
-
4
-
5
-
6
-
7
-
8
-
9
-
10
-
11
-
12
-
13
-
14
-
15
-
16
-
17
-
18
-
19
-
20
-
21
-
22
-
23
-
24
-
25
-
 26
26 -
 27
27 -
 28
28 -
 29
29 -
 30
30 -
 31
31 -
 32
32 -
 33
33 -
 34
34 -
 35
35 -
 36
36 -
 37
37 -
 38
38 -
 39
39 -
 40
40 -
 41
41 -
 42
42 -
 43
43 -
 44
44 -
 45
45 -
 46
46 -
47
-
48
-
49
-
50
-
51
-
52
-
53
-
54
-
55
-
56
-
57
-
58
-
59
-
60
-
61
-
62
-
63
-
64
-
65
-
66
-
67
-
68
-
69
-
70
-
71
-
72
-
73
-
74
-
75
-
76
-
77
-
78
-
79
-
80
-
81
-
82
-
83
-
84
-
85
-
86
-
87
-
88
-
89
-
90
-
91
-
92
-
93
-
94
-
95
-
96
-
97
-
98
-
99
-
100
 |
 |

Management’s Discussion and Analysis of Financial Condition and Results of Operations (continued)
Dollars in millions except per share amounts
34 AT&T Inc.
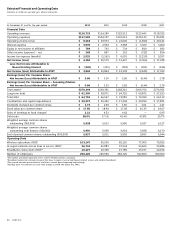
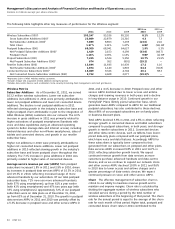
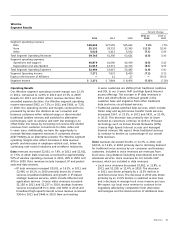
The following table highlights other key measures of performance for the Wireless segment:
2011 vs. 2010 vs.
2011 2010 2009 2010 2009
Wireless Subscribers (000)1 103,247 95,536 85,120 8.1% 12.2%
Gross Subscriber Additions (000)2 23,869 22,879 21,316 4.3 7.3
Net Subscriber Additions (000)2 7,699 8,853 7,278 (13.0) 21.6
Total Churn 1.37% 1.31% 1.47% 6 BP (16) BP
Postpaid Subscribers (000) 69,309 68,041 64,627 1.9% 5.3%
Net Postpaid Subscriber Additions (000)2 1,429 2,153 4,199 (33.6) (48.7)
Postpaid Churn 1.18% 1.09% 1.13% 9 BP (4) BP
Prepaid Subscribers (000) 7,225 6,524 5,350 10.7% 21.9%
Net Prepaid Subscriber Additions (000)2 674 952 (801) (29.2) —
Reseller Subscribers (000) 13,644 11,645 10,439 17.2 11.6
Net Reseller Subscriber Additions (000)2 1,874 1,140 1,803 64.4 (36.8)
Connected Device Subscribers (000)3 13,069 9,326 4,704 40.1 98.3
Net Connected Device Subscriber Additions (000) 3,722 4,608 2,077 (19.2)% —
1Represents 100% of AT&T Mobility wireless customers.
2Excludes merger and acquisition-related additions during the period.
3Includes data-centric devices such as eReaders, home security monitoring, fleet management, and smart grid devices.
2011 and a 4.1% decrease in 2010. Postpaid voice and other
service ARPU declined due to lower access and airtime
charges and roaming revenues in both years and a decline
in long-distance usage in 2010. Continued growth in our
FamilyTalk® Plans (family plans) subscriber base, which
generates lower ARPU compared to ARPU for our traditional
postpaid subscribers, has also contributed to these declines.
About 86% of our postpaid subscribers are on family plans
or business discount plans.
Total ARPU declined 3.8% in 2011 and 1.8% in 2010, reflecting
stronger growth in connected devices and tablet subscribers
compared to postpaid subscribers, in both years, and stronger
growth in reseller subscribers in 2011. Connected devices
and other data-centric devices, such as tablets, have lower-
priced data-only plans compared with our postpaid plans,
which have voice and data features. Accordingly, ARPU for
these subscribers is typically lower compared to that
generated from our subscribers on postpaid and other plans.
Data services ARPU increased 9.8% in 2011 and 14.7% in
2010, reflecting subscriber growth trends. We expect
continued revenue growth from data services as more
customers purchase advanced handsets and data-centric
devices, and as we continue to expand our network. Voice
and other service ARPU declined 10.8% in 2011 and 8.6%
in 2010 due to lower access and airtime charges and a
greater percentage of data-centric devices. We expect
continued pressure on voice and other service ARPU.
Churn The effective management of subscriber churn is
critical to our ability to maximize revenue growth and to
maintain and improve margins. Churn rate is calculated by
dividing the aggregate number of wireless subscribers who
canceled service during a period by the total number of
wireless subscribers at the beginning of that period. The churn
rate for the annual period is equal to the average of the churn
rate for each month of that period. Higher total, postpaid and
connected device churn rates in 2011 contributed to the
Wireless Metrics
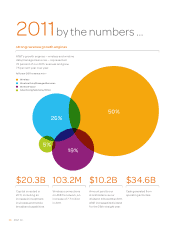
Subscriber Additions As of December 31, 2011, we served
103.2 million wireless subscribers. Lower net subscriber
additions (net additions) in 2011 were primarily attributable to
lower net postpaid additions and lower net connected device
additions. The decline in net postpaid additions in 2011
reflected slowing growth in the industry’s subscriber base and
higher postpaid churn attributable in part to the integration of
Alltel Wireless (Alltel) customers into our network. The 4.3%
increase in gross additions in 2011 was primarily related to
higher activations of postpaid smartphones (handsets with
voice and data capabilities using an advanced operating
system to better manage data and Internet access), including
Android devices and other non-iPhone smartphones, sales of
tablets and connected devices, and growth in our reseller
subscriber base.
Higher net additions in 2010 were primarily attributable to
higher net connected device additions. Lower net postpaid
additions in 2010 reflected slowing growth in the industry’s
subscriber base and lower postpaid churn throughout the
industry. The 7.3% increase in gross additions in 2010 was
primarily related to higher sales of connected devices.
Average service revenue per user (ARPU) from postpaid
subscribers increased 1.8% in 2011 and 2.9% in 2010, driven
by increases in postpaid data services ARPU of 15.3% in 2011
and 19.3% in 2010, reflecting increased usage of more
advanced handsets by our subscribers. Of our total postpaid
subscriber base, 71% now use more advanced handsets
(with 57% using smartphones), up from 61% a year earlier
(with 43% using smartphones) and 47% two years ago (with
33% using smartphones). Approximately 72% of our postpaid
subscribers were on data plans as of December 31, 2011,
up from 63% as of December 31, 2010. The growth in postpaid
data services ARPU in 2011 and 2010 was partially offset by
a 5.3% decrease in postpaid voice and other service ARPU in