AT&T Wireless 2011 Annual Report Download - page 35
Download and view the complete annual report
Please find page 35 of the 2011 AT&T Wireless annual report below. You can navigate through the pages in the report by either clicking on the pages listed below, or by using the keyword search tool below to find specific information within the annual report.-
 1
1 -
2
-
3
-
4
-
5
-
6
-
7
-
8
-
9
-
10
-
11
-
12
-
13
-
14
-
15
-
16
-
17
-
18
-
19
-
20
-
21
-
22
-
23
-
24
-
 25
25 -
 26
26 -
 27
27 -
 28
28 -
 29
29 -
 30
30 -
 31
31 -
 32
32 -
 33
33 -
 34
34 -
 35
35 -
 36
36 -
 37
37 -
 38
38 -
 39
39 -
 40
40 -
 41
41 -
 42
42 -
 43
43 -
 44
44 -
 45
45 -
46
-
47
-
48
-
49
-
50
-
51
-
52
-
53
-
54
-
55
-
56
-
57
-
58
-
59
-
60
-
61
-
62
-
63
-
64
-
65
-
66
-
67
-
68
-
69
-
70
-
71
-
72
-
73
-
74
-
75
-
76
-
77
-
78
-
79
-
80
-
81
-
82
-
83
-
84
-
85
-
86
-
87
-
88
-
89
-
90
-
91
-
92
-
93
-
94
-
95
-
96
-
97
-
98
-
99
-
100
 |
 |

AT&T Inc. 33
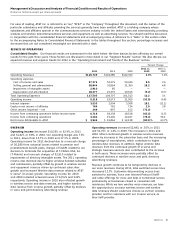
The Other segment accounted for less than 1% of our
2011 and 2010 total segment operating revenues. Since
segment operating expenses exceeded revenue in both
years, a segment loss was incurred in both 2011 and 2010.
This segment includes results from customer information
services, our portion of the results from our international
equity investments and all corporate and other operations.
Also included in the Other segment are impacts of corporate-
wide decisions for which the individual operating segments
are not being evaluated, including interest cost and expected
return on pension and postretirement benefits assets.
Operations and support expenses include bad debt expense;
advertising costs; sales and marketing functions, including
customer service centers; real estate costs, including
maintenance and utilities on all buildings; credit and collection
functions; and corporate support costs, such as finance,
legal, human resources and external affairs. Pension and
postretirement service costs, net of amounts capitalized as
part of construction labor, are also included to the extent that
they are associated with these employees. Our Wireless and
Wireline segments also include certain network planning and
engineering expenses, information technology, our repair
technicians and repair services, and property taxes as
operations and support expenses.
The following sections discuss our operating results by
segment. We discuss capital expenditures for each segment
in “Liquidity and Capital Resources.”
The Wireless segment accounted for approximately 50%
of our 2011 total segment operating revenues as compared
to 47% in 2010 and 94% of our 2011 total segment income
as compared to 67% in 2010. This segment uses our
nationwide network to provide consumer and business
customers with wireless voice and advanced data
communications services.
The Wireline segment accounted for approximately 47%
of our 2011 total segment operating revenues as compared
to 49% in 2010 and 45% of our 2011 total segment income
as compared to 34% in 2010. This segment uses our regional,
national and global network to provide consumer and
business customers with landline voice and data
communications services, AT&T U-verse TV, high-speed
broadband, and voice services and managed networking
to business customers.
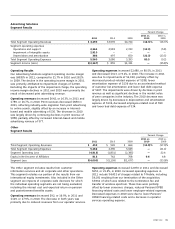
The Advertising Solutions segment accounted for
approximately 3% of our 2011 and 2010 total segment
operating revenues. During 2011, expenses exceeded revenue
and the segment incurred a loss, due to recorded impairments
of goodwill and a trade name. During 2010, segment income
was 4% of our 2010 total segment income. This segment
includes our directory operations, which publish Yellow and
White Pages directories and sell directory advertising,
Internet-based advertising and local search.
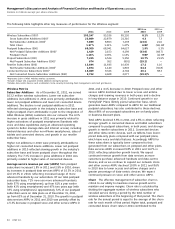
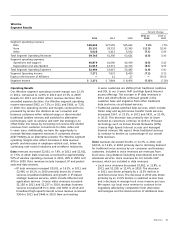
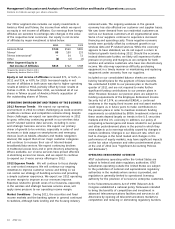
Wireless
Segment Results
Percent Change
2011 vs. 2010 vs.
2011 2010 2009 2010 2009
Segment operating revenues
Service $56,726 $53,510 $48,563 6.0% 10.2%
Equipment 6,486 4,990 4,941 30.0 1.0
Total Segment Operating Revenues 63,212 58,500 53,504 8.1 9.3
Segment operating expenses
Operations and support 41,581 36,746 33,631 13.2 9.3
Depreciation and amortization 6,324 6,497 6,043 (2.7) 7.5
Total Segment Operating Expenses 47,905 43,243 39,674 10.8 9.0
Segment Operating Income 15,307 15,257 13,830 0.3 10.3
Equity in Net Income (Loss) of Affiliates (29) 9 9 — —
Segment Income $15,278 $15,266 $13,839 0.1% 10.3%