AT&T Wireless 2011 Annual Report Download - page 54
Download and view the complete annual report
Please find page 54 of the 2011 AT&T Wireless annual report below. You can navigate through the pages in the report by either clicking on the pages listed below, or by using the keyword search tool below to find specific information within the annual report.-
 1
1 -
2
-
3
-
4
-
5
-
6
-
7
-
8
-
9
-
10
-
11
-
12
-
13
-
14
-
15
-
16
-
17
-
18
-
19
-
20
-
21
-
22
-
23
-
24
-
25
-
26
-
27
-
28
-
29
-
30
-
31
-
32
-
33
-
34
-
35
-
36
-
37
-
38
-
39
-
40
-
41
-
42
-
43
-
 44
44 -
 45
45 -
 46
46 -
 47
47 -
 48
48 -
 49
49 -
 50
50 -
 51
51 -
 52
52 -
 53
53 -
 54
54 -
 55
55 -
 56
56 -
 57
57 -
 58
58 -
 59
59 -
 60
60 -
 61
61 -
 62
62 -
 63
63 -
 64
64 -
65
-
66
-
67
-
68
-
69
-
70
-
71
-
72
-
73
-
74
-
75
-
76
-
77
-
78
-
79
-
80
-
81
-
82
-
83
-
84
-
85
-
86
-
87
-
88
-
89
-
90
-
91
-
92
-
93
-
94
-
95
-
96
-
97
-
98
-
99
-
100
 |
 |
Management’s Discussion and Analysis of Financial Condition and Results of Operations (continued)
Dollars in millions except per share amounts
52 AT&T Inc.
Foreign Exchange Risk
We are exposed to foreign currency exchange risk through our
foreign affiliates and equity investments in foreign companies.
We do not hedge foreign currency translation risk in the net
assets and income we report from these sources. However, we
do hedge a large portion of the exchange risk involved in
anticipation of highly probable foreign currency-denominated
transactions and cash flow streams, such as those related to
issuing foreign-denominated debt, receiving dividends from
foreign investments, and other receipts and disbursements.
Through cross-currency swaps, all our foreign-denominated
debt has been swapped from fixed-rate foreign currencies to
fixed-rate U.S. dollars at issuance, removing interest rate risk
and foreign currency exchange risk associated with the
underlying interest and principal payments. We expect gains
or losses in our cross-currency swaps to offset the losses
and gains in the financial instruments they hedge.
In anticipation of other foreign currency-denominated
transactions, we often enter into foreign exchange forward
contracts to provide currency at a fixed rate. Our policy is
to measure the risk of adverse currency fluctuations by
calculating the potential dollar losses resulting from changes
in exchange rates that have a reasonable probability of
occurring. We cover the exposure that results from changes
that exceed acceptable amounts.
For the purpose of assessing specific risks, we use a sensitivity
analysis to determine the effects that market risk exposures
may have on the fair value of our financial instruments and
results of operations. To perform the sensitivity analysis, we
assess the risk of loss in fair values from the effect of a
hypothetical 10% depreciation of the U.S. dollar against foreign
currencies from the prevailing foreign currency exchange rates,
assuming no change in interest rates. For foreign exchange
forward contracts outstanding at December 31, 2011, the
change in fair value was immaterial. Furthermore, because
our foreign exchange contracts are entered into for hedging
purposes, we believe that these losses would be largely
offset by gains on the underlying transactions.
Issuer Equity Repurchases
On December 17, 2010, our Board of Directors authorized
a new share repurchase plan of 300 million shares with no
expiration date. This authorization represented approximately
5.0% of AT&T’s shares outstanding at December 31, 2011.
During 2010 and 2011, we did not repurchase any shares
under this plan. In January 2012, we started to repurchase a
portion of the shares pursuant to plans that comply with the
requirements of Rule 10b5-1(c) under the Securities Exchange
Act of 1934. We will fund any share repurchases through a
combination of cash from operations, borrowings dependent
on market conditions, or cash from the disposition of certain
non-strategic investments.
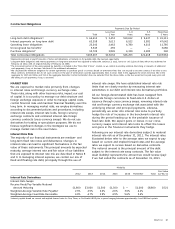
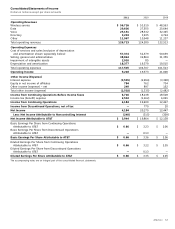
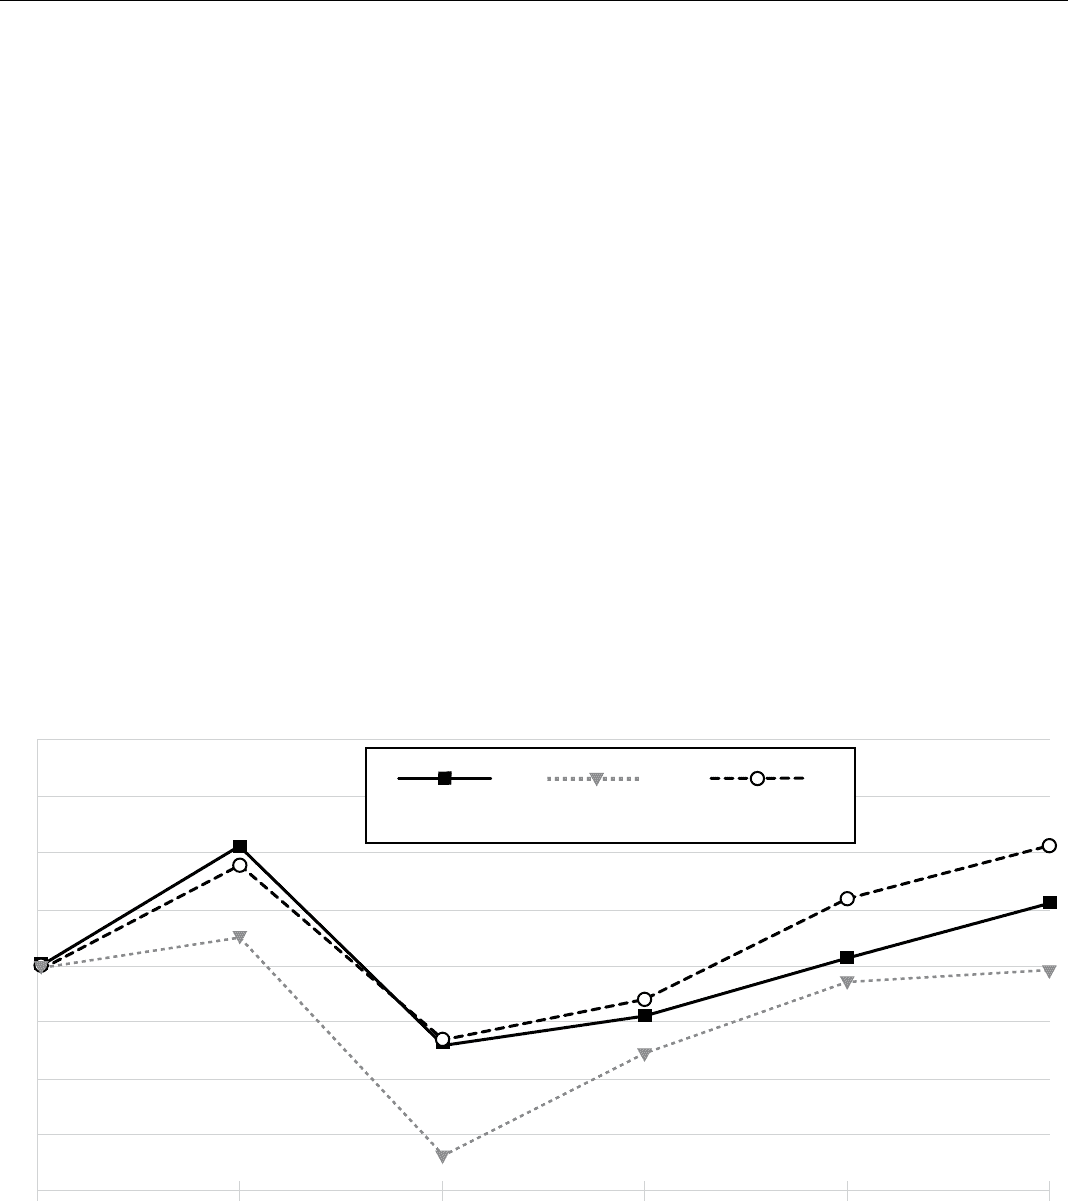
STOCK PERFORMANCE GRAPH
Comparison of Five Year Cumulative Total Return
AT&T Inc., S&P 500 Index, and S&P 500 Integrated Telecom Index
140
130
120
110
100
90
80
70
60
12/06 12/07 12/08 12/09 12/10 12/11
100
105
S&P 500 Integrated
Telecom Index
AT&T Inc. S&P 500 Index
66
84
97
99
118
88 91
112
121
121
87
102
111
94
The comparison above assumes $100 invested on December 31, 2006, in AT&T common stock, Standard & Poor’s 500 Index
(S&P 500), and Standard & Poor’s 500 Integrated Telecom Index (S&P 500 Integrated Telecom). Total return equals stock price
appreciation plus reinvestment of dividends.