AT&T Wireless 2011 Annual Report Download - page 70
Download and view the complete annual report
Please find page 70 of the 2011 AT&T Wireless annual report below. You can navigate through the pages in the report by either clicking on the pages listed below, or by using the keyword search tool below to find specific information within the annual report.-
 1
1 -
2
-
3
-
4
-
5
-
6
-
7
-
8
-
9
-
10
-
11
-
12
-
13
-
14
-
15
-
16
-
17
-
18
-
19
-
20
-
21
-
22
-
23
-
24
-
25
-
26
-
27
-
28
-
29
-
30
-
31
-
32
-
33
-
34
-
35
-
36
-
37
-
38
-
39
-
40
-
41
-
42
-
43
-
44
-
45
-
46
-
47
-
48
-
49
-
50
-
51
-
52
-
53
-
54
-
55
-
56
-
57
-
58
-
59
-
 60
60 -
 61
61 -
 62
62 -
 63
63 -
 64
64 -
 65
65 -
 66
66 -
 67
67 -
 68
68 -
 69
69 -
 70
70 -
 71
71 -
 72
72 -
 73
73 -
 74
74 -
 75
75 -
 76
76 -
 77
77 -
 78
78 -
 79
79 -
 80
80 -
81
-
82
-
83
-
84
-
85
-
86
-
87
-
88
-
89
-
90
-
91
-
92
-
93
-
94
-
95
-
96
-
97
-
98
-
99
-
100
 |
 |
Notes to Consolidated Financial Statements (continued)
Dollars in millions except per share amounts
68 AT&T Inc.
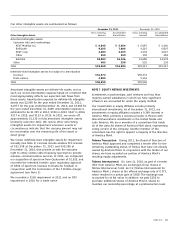
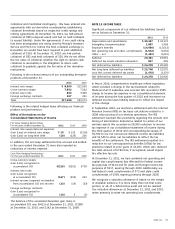
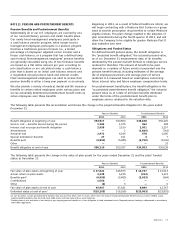
NOTE 5. PROPERTY, PLANT AND EQUIPMENT
Property, plant and equipment is summarized as follows at
December 31:
Lives (years) 2011 2010
Land — $ 1,689 $ 1,694
Buildings and improvements 10-45 28,054 25,979
Central office equipment1 3-10 83,824 79,607
Cable, wiring and conduit 10-50 78,431 75,732
Other equipment 5-20 53,104 46,622
Software 3-5 10,041 9,219
Under construction — 5,136 4,980
260,279 243,833
Accumulated depreciation
and amortization 153,192 140,637
Property, plant and
equipment – net $107,087 $103,196
1Includes certain network software.
Our depreciation expense was $16,368 in 2011, $16,402 in
2010 and $15,849 in 2009. Depreciation expense included
amortization of software totaling $2,243 in 2011, $2,515 in
2010 and $1,731 in 2009.
Certain facilities and equipment used in operations are leased
under operating or capital leases. Rental expenses under
operating leases were $3,610 for 2011, $3,060 for 2010, and
$2,889 for 2009. At December 31, 2011, the future minimum
rental payments under noncancelable operating leases for
the years 2012 through 2016 were $2,462, $2,459, $2,321,
$2,183, and $2,032, with $11,785 due thereafter. Certain real
estate operating leases contain renewal options that may be
exercised. Capital leases are not significant.
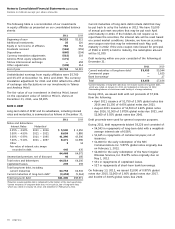
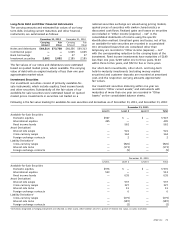
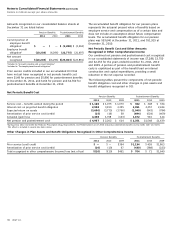
NOTE 6. GOODWILL AND OTHER INTANGIBLE ASSETS
Changes in the carrying amounts of goodwill, by segment (which is the same as the reporting unit for Wireless, Wireline and
Advertising Solutions), for the years ended December 31, 2011 and 2010, were as follows:
Advertising
Wireless Wireline Solutions Other Total
Balance as of January 1, 2010 $ 35,037 $ 31,608 $ 5,731 $ 406 $ 72,782
Goodwill acquired 937 — — 43 980
Other (219) 62 — (4) (161)
Balance as of December 31, 2010 35,755 31,670 5,731 445 73,601
Goodwill acquired 5 — — — 5
Impairments — — (2,745) — (2,745)
Other (5) 1,968 (1,927) (55) (19)
Balance as of December 31, 2011 $35,755 $33,638 $1,059 $390 $70,842
Goodwill acquisitions in 2010 related primarily to the
acquisition of certain wireless properties from Verizon Wireless
(see Note 2). In 2011, we recorded a $2,745 impairment in
the Advertising Solutions segment, triggered by declining
revenues in our directory business and the directory industry
as a whole. Changes to goodwill during 2011 also included a
$1,927 reclassification of goodwill from the Advertising
Solutions segment to the Wireline segment to align certain
advertising operations with our U-verse business, which
operates the media platform for those advertising operations.
Changes to goodwill during 2010 included adjustments
totaling $(219) related to wireless business combinations and
$62 due primarily to adjustments relating to a wireline
business combination (see Note 2).