AT&T Wireless 2011 Annual Report Download - page 89
Download and view the complete annual report
Please find page 89 of the 2011 AT&T Wireless annual report below. You can navigate through the pages in the report by either clicking on the pages listed below, or by using the keyword search tool below to find specific information within the annual report.-
 1
1 -
2
-
3
-
4
-
5
-
6
-
7
-
8
-
9
-
10
-
11
-
12
-
13
-
14
-
15
-
16
-
17
-
18
-
19
-
20
-
21
-
22
-
23
-
24
-
25
-
26
-
27
-
28
-
29
-
30
-
31
-
32
-
33
-
34
-
35
-
36
-
37
-
38
-
39
-
40
-
41
-
42
-
43
-
44
-
45
-
46
-
47
-
48
-
49
-
50
-
51
-
52
-
53
-
54
-
55
-
56
-
57
-
58
-
59
-
60
-
61
-
62
-
63
-
64
-
65
-
66
-
67
-
68
-
69
-
70
-
71
-
72
-
73
-
74
-
75
-
76
-
77
-
78
-
 79
79 -
 80
80 -
 81
81 -
 82
82 -
 83
83 -
 84
84 -
 85
85 -
 86
86 -
 87
87 -
 88
88 -
 89
89 -
 90
90 -
 91
91 -
 92
92 -
 93
93 -
 94
94 -
 95
95 -
 96
96 -
 97
97 -
 98
98 -
 99
99 -
100
 |
 |

AT&T Inc. 87
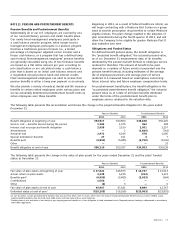
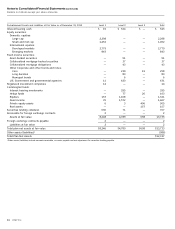
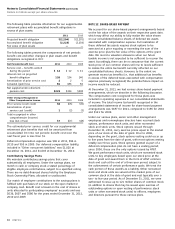
Estimated Future Benefit Payments
Expected benefit payments are estimated using the same
assumptions used in determining our benefit obligation at
December 31, 2011. Because benefit payments will depend
on future employment and compensation levels, average
years employed and average life spans, among other factors,
changes in any of these factors could significantly affect these
expected amounts. The following table provides expected
benefit payments under our pension and postretirement plans:
Medicare
Pension Postretirement Subsidy
Benefits Benefits Receipts
2012 $ 6,629 $ 2,500 $(119)
2013 4,213 2,341 (19)
2014 4,174 2,292 (23)
2015 4,170 2,235 (26)
2016 4,160 2,210 (30)
Years 2017 – 2021 20,711 10,770 (201)
Supplemental Retirement Plans
We also provide certain senior- and middle-management
employees with nonqualified, unfunded supplemental
retirement and savings plans. While these plans are unfunded,
we have assets in a designated nonbankruptcy remote trust
that are independently managed and used to provide for
these benefits. These plans include supplemental pension
benefits as well as compensation-deferral plans, some of
which include a corresponding match by us based on a
percentage of the compensation deferral.
We use the same significant assumptions for the discount
rate and composite rate of compensation increase used in
determining the projected benefit obligation and the net
pension and postemployment benefit cost. The following
tables provide the plans’ benefit obligations and fair value
of assets at December 31 and the components of the
supplemental retirement pension benefit cost. The net amount
recorded as “Other noncurrent liabilities” on our consolidated
balance sheets at December 31, 2011, was $2,294 and $2,270
at December 31, 2010.
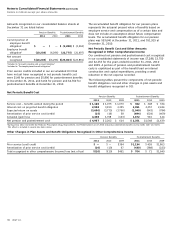
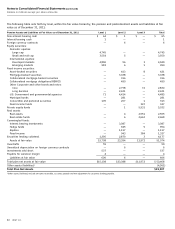
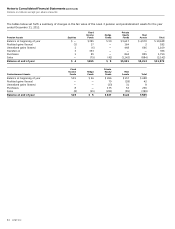
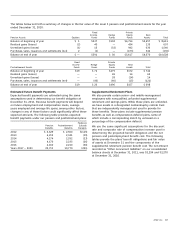
The tables below set forth a summary of changes in the fair value of the Level 3 pension and postretirement assets for the year
ended December 31, 2010:
Fixed Private
Income Hedge Equity Real
Pension Assets Equities Funds Funds Funds Assets Total
Balance at beginning of year $ 1 $337 $102 $4,714 $3,457 $ 8,611
Realized gains (losses) (2) 40 — 434 135 607
Unrealized gains (losses) (1) 15 (52) 942 636 1,540
Purchases, sales, issuances and settlements (net) 2 (1) — (473) 342 (130)
Balance at end of year $ — $391 $ 50 $5,617 $4,570 $10,628
Fixed Private
Income Hedge Equity Real
Postretirement Assets Funds Funds Funds Assets Total
Balance at beginning of year $19 $ 72 $479 $172 $ 742
Realized gains (losses) — — 49 14 63
Unrealized gains (losses) — — 28 (14) 14
Purchases, sales, issuances and settlements (net) — (46) (60) (15) (121)
Balance at end of year $19 $ 26 $496 $157 $ 698