AT&T Wireless 2011 Annual Report Download - page 33
Download and view the complete annual report
Please find page 33 of the 2011 AT&T Wireless annual report below. You can navigate through the pages in the report by either clicking on the pages listed below, or by using the keyword search tool below to find specific information within the annual report.-
 1
1 -
2
-
3
-
4
-
5
-
6
-
7
-
8
-
9
-
10
-
11
-
12
-
13
-
14
-
15
-
16
-
17
-
18
-
19
-
20
-
21
-
22
-
 23
23 -
 24
24 -
 25
25 -
 26
26 -
 27
27 -
 28
28 -
 29
29 -
 30
30 -
 31
31 -
 32
32 -
 33
33 -
 34
34 -
 35
35 -
 36
36 -
 37
37 -
 38
38 -
 39
39 -
 40
40 -
 41
41 -
 42
42 -
 43
43 -
44
-
45
-
46
-
47
-
48
-
49
-
50
-
51
-
52
-
53
-
54
-
55
-
56
-
57
-
58
-
59
-
60
-
61
-
62
-
63
-
64
-
65
-
66
-
67
-
68
-
69
-
70
-
71
-
72
-
73
-
74
-
75
-
76
-
77
-
78
-
79
-
80
-
81
-
82
-
83
-
84
-
85
-
86
-
87
-
88
-
89
-
90
-
91
-
92
-
93
-
94
-
95
-
96
-
97
-
98
-
99
-
100
 |
 |

AT&T Inc. 31
Management’s Discussion and Analysis of Financial Condition and Results of Operations
Dollars in millions except per share amounts
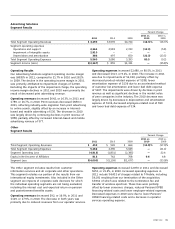
Operating revenues increased $2,443, or 2.0%, in 2011
and $1,767, or 1.4%, in 2010. The increases in 2011 and
2010 reflect continued growth in wireless service revenues
driven by increases in the subscriber base and the increasing
percentage of smartphones, which contribute to higher
wireless data revenues. In addition, higher wireline data
revenues from the continued growth of U-verse and
strategic business services also contributed to the increase
in both years. These increases were partially offset by
continued declines in wireline voice and print directory
advertising revenues.
Revenue growth continues to be tempered by declines in
our voice revenues. During 2011, total switched access lines
decreased 12.3%. Customers disconnecting access lines
switched to wireless, Voice over Internet Protocol (VoIP)
and cable offerings for voice and data or terminated service
permanently as businesses closed or consumers left
residences. While we lose wireline voice revenues, we have
the opportunity to increase wireless service and wireline
data revenues should customers choose us as their wireless
provider, and for customers with our U-verse service, as
their VoIP provider.
OVERVIEW
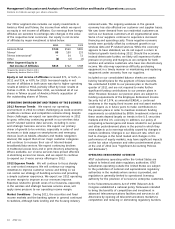
Operating income decreased $10,355, or 52.9%, in 2011
and $1,427, or 6.8%, in 2010. Our operating margin was 7.3%
in 2011, down from 15.7% in 2010 and 17.1% in 2009.
Operating income for 2011 declined due to a noncash charge
of $6,280 from actuarial losses related to pension and
postretirement benefit plans, charges of $4,181 related to our
decision to terminate the acquisition of T-Mobile USA, Inc.
(T-Mobile) and noncash charges of $2,910 related to
impairments of directory intangible assets. The 2011 operating
income also declined due to higher wireless handset subsidies
and commissions, partially offset by growth in wireless service
and equipment revenue driven by continued subscriber
growth and increased Wireline data revenue related to AT&T
U-verse® (U-verse) growth. Operating income for 2010
and 2009 included actuarial losses of $2,521 and $215,
respectively. Operating income in 2010 also reflected growth
in wireless service and data revenues, and higher wireline
data revenue from U-verse growth, partially offset by declines
in voice and print directory advertising revenue.
For ease of reading, AT&T Inc. is referred to as “we,” “AT&T” or the “Company” throughout this document, and the names of the
particular subsidiaries and affiliates providing the services generally have been omitted. AT&T is a holding company whose
subsidiaries and affiliates operate in the communications services industry in both the United States and internationally, providing
wireless and wireline telecommunications services and equipment as well as advertising services. You should read this discussion
in conjunction with the consolidated financial statements and accompanying notes. A reference to a “Note” in this section refers
to the accompanying Notes to Consolidated Financial Statements. In the tables throughout this section, percentage increases and
decreases that are not considered meaningful are denoted with a dash.
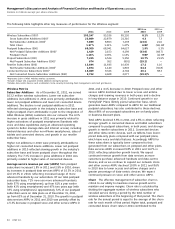
RESULTS OF OPERATIONS
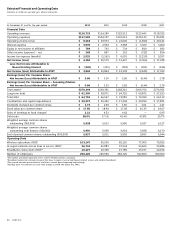
Consolidated Results Our financial results are summarized in the table below. We then discuss factors affecting our overall
results for the past three years. These factors are discussed in more detail in our “Segment Results” section. We also discuss our
expected revenue and expense trends for 2012 in the “Operating Environment and Trends of the Business” section.
Percent Change
2011 vs. 2010 vs.
2011 2010 2009 2010 2009
Operating Revenues $126,723 $124,280 $122,513 2.0% 1.4%
Operating expenses
Cost of services and sales 57,374 52,379 50,639 9.5 3.4
Selling, general and administrative 38,844 32,864 31,359 18.2 4.8
Impairment of intangible assets 2,910 85 — — —
Depreciation and amortization 18,377 19,379 19,515 (5.2) (0.7)
Total Operating Expenses 117,505 104,707 101,513 12.2 3.1
Operating Income 9,218 19,573 21,000 (52.9) (6.8)
Interest expense 3,535 2,994 3,368 18.1 (11.1)
Equity in net income of affiliates 784 762 734 2.9 3.8
Other income (expense) – net 249 897 152 (72.2) —
Income from continuing operations before income taxes 6,716 18,238 18,518 (63.2) (1.5)
Income from continuing operations 4,184 19,400 12,427 (78.4) 56.1
Net Income Attributable to AT&T $ 3,944 $ 19,864 $ 12,138 (80.1)% 63.7%