Supercuts 2009 Annual Report Download - page 59
Download and view the complete annual report
Please find page 59 of the 2009 Supercuts annual report below. You can navigate through the pages in the report by either clicking on the pages listed below, or by using the keyword search tool below to find specific information within the annual report.-
 1
1 -
2
-
3
-
4
-
5
-
6
-
7
-
8
-
9
-
10
-
11
-
12
-
13
-
14
-
15
-
16
-
17
-
18
-
19
-
20
-
21
-
22
-
23
-
24
-
25
-
26
-
27
-
28
-
29
-
30
-
31
-
32
-
33
-
34
-
35
-
36
-
37
-
38
-
39
-
40
-
41
-
42
-
43
-
44
-
45
-
46
-
47
-
48
-
 49
49 -
 50
50 -
 51
51 -
 52
52 -
 53
53 -
 54
54 -
 55
55 -
 56
56 -
 57
57 -
 58
58 -
 59
59 -
 60
60 -
 61
61 -
 62
62 -
 63
63 -
 64
64 -
 65
65 -
 66
66 -
 67
67 -
 68
68 -
 69
69 -
70
-
71
-
72
-
73
-
74
-
75
-
76
-
77
-
78
-
79
-
80
-
81
-
82
-
83
-
84
-
85
-
86
-
87
-
88
-
89
-
90
-
91
-
92
-
93
-
94
-
95
-
96
-
97
-
98
-
99
-
100
-
101
-
102
-
103
-
104
-
105
-
106
-
107
-
108
-
109
-
110
-
111
-
112
-
113
-
114
-
115
-
116
-
117
-
118
-
119
-
120
-
121
-
122
-
123
-
124
-
125
-
126
-
127
-
128
-
129
-
130
-
131
-
132
-
133
-
134
-
135
-
136
-
137
-
138
-
139
-
140
-
141
-
142
-
143
-
144
-
145
-
146
-
147
-
148
-
149
-
150
-
151
-
152
-
153
-
154
-
155
-
156
-
157
-
158
-
159
-
160
 |
 |

Table of Contents
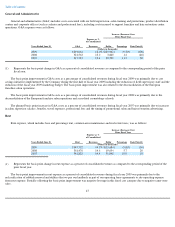
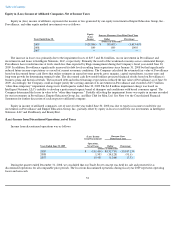
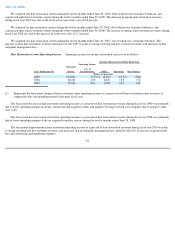
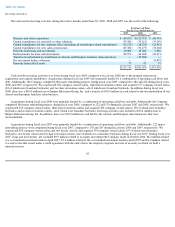
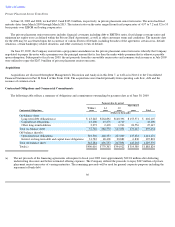
International Salon Operating Income. Operating income for the international salons was as follows:
(1)
Increase (Decrease) Over Prior Fiscal Year
Operating (Loss)
income
as % of
Total Revenues
Years Ended June 30,
Operating
(Loss) income
Dollar
Percentage
Basis Point(1)
(Dollars in thousands)
2009
$
(45,481
)
(26.5
)%
$
(57,132
)
(490.4
)%
(3,110
)
2008
11,651
4.6
(5,897
)
(33.6
)
(230
)
2007
17,548
6.9
3,986
29.4
80
Represents the basis point change in international salon operating income (loss) as a percent of total international salon revenues as
compared to the corresponding period of the prior fiscal year.
The basis point decrease in international salon operating income as a percent of international salon revenues during fiscal year 2009 was
primarily due to negative same-store sales and the $41.7 million goodwill impairment of the United Kingdom reporting unit during the fiscal
year 2009.
The basis point decrease in international salon operating income as a percent of international salon revenues during fiscal year 2008 was
primarily due to the deconsolidation of our European franchise salon operations, negative same-store sales, and higher impairment charges of
$1.1 million related to the Company approved plan to close underperforming company-owned salon locations in fiscal year 2009. These
decreases were offset by the inclusion of the Sassoon schools in the segment.
The basis point improvement in international salon operating income as a percent of international salon revenues during fiscal year 2007
was primarily due to improved product margins and severance expenses incurred in fiscal 2006 that did not occur in fiscal 2007. A same-store
product sales increase of 7.1 percent for the twelve months ended June 30, 2007 also contributed to the improvement.
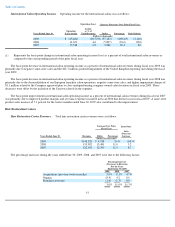
Hair Restoration Centers
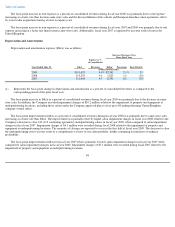
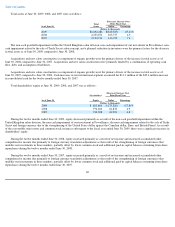
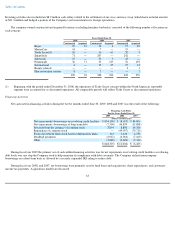
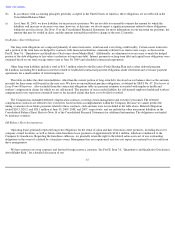
Hair Restoration Center Revenues. Total hair restoration center revenues were as follows:
The percentage increases during the years ended June 30, 2009, 2008, and 2007 were due to the following factors:
57
Increase Over Prior
Fiscal Year
Same
-
Store
Sales
(Decrease)
Increase
Years Ended June 30,
Revenues
Dollar
Percentage
(Dollars in thousands)
2009
$
140,520
$
4,938
3.6
%
(0.8
)%
2008
135,582
13,481
11.0
5.2
2007
122,101
12,399
11.3
8.7
Percentage Increase
(Decrease) in Revenues
For the Years
Ended June 30, 2009
2009
2008
2007
Acquisitions (previous twelve months)
5.9
%
8.1
%
4.7
%
Organic
(0.9
)
4.2
6.6
Franchise revenues
(1.4
)
(1.3
)
0.0
3.6
%
11.0
%
11.3
%