Supercuts 2009 Annual Report Download - page 103
Download and view the complete annual report
Please find page 103 of the 2009 Supercuts annual report below. You can navigate through the pages in the report by either clicking on the pages listed below, or by using the keyword search tool below to find specific information within the annual report.-
 1
1 -
2
-
3
-
4
-
5
-
6
-
7
-
8
-
9
-
10
-
11
-
12
-
13
-
14
-
15
-
16
-
17
-
18
-
19
-
20
-
21
-
22
-
23
-
24
-
25
-
26
-
27
-
28
-
29
-
30
-
31
-
32
-
33
-
34
-
35
-
36
-
37
-
38
-
39
-
40
-
41
-
42
-
43
-
44
-
45
-
46
-
47
-
48
-
49
-
50
-
51
-
52
-
53
-
54
-
55
-
56
-
57
-
58
-
59
-
60
-
61
-
62
-
63
-
64
-
65
-
66
-
67
-
68
-
69
-
70
-
71
-
72
-
73
-
74
-
75
-
76
-
77
-
78
-
79
-
80
-
81
-
82
-
83
-
84
-
85
-
86
-
87
-
88
-
89
-
90
-
91
-
92
-
 93
93 -
 94
94 -
 95
95 -
 96
96 -
 97
97 -
 98
98 -
 99
99 -
 100
100 -
 101
101 -
 102
102 -
 103
103 -
 104
104 -
 105
105 -
 106
106 -
 107
107 -
 108
108 -
 109
109 -
 110
110 -
 111
111 -
 112
112 -
 113
113 -
114
-
115
-
116
-
117
-
118
-
119
-
120
-
121
-
122
-
123
-
124
-
125
-
126
-
127
-
128
-
129
-
130
-
131
-
132
-
133
-
134
-
135
-
136
-
137
-
138
-
139
-
140
-
141
-
142
-
143
-
144
-
145
-
146
-
147
-
148
-
149
-
150
-
151
-
152
-
153
-
154
-
155
-
156
-
157
-
158
-
159
-
160
 |
 |

Table of Contents
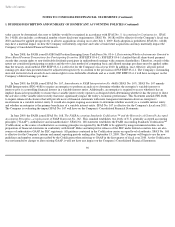
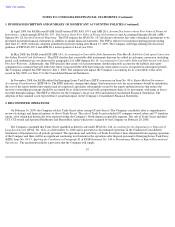
NOTES TO CONSOLIDATED FINANCIAL STATEMENTS (Continued)
3. OTHER FINANCIAL STATEMENT DATA (Continued)
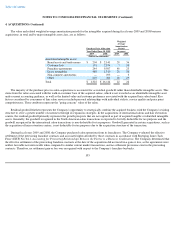
amount of economic benefits obtained by the Company in that reporting period. The weighted average amortization periods, in total and by
major intangible asset class, are as follows:
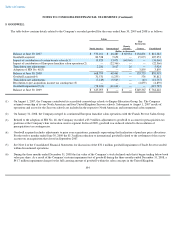
Total amortization expense related to amortizable intangible assets during the years ended June 30, 2009, 2008, and 2007 was
approximately $9.9, $11.1, and $11.8 million, respectively. As of June 30, 2009, future estimated amortization expense related to amortizable
intangible assets is estimated to be:
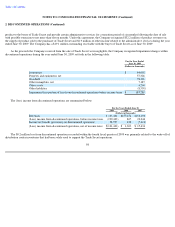
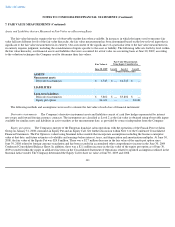
The following provides supplemental disclosures of cash flow activity:
Significant non-cash investing and financing activities include the following:
In fiscal years 2009, 2008, and 2007, the Company financed capital expenditures totaling $7.5, $10.4, and $14.5 million, respectively,
through capital leases.
4. ACQUISITIONS
During fiscal years 2009, 2008, and 2007, the Company made numerous acquisitions and the purchase prices have been allocated to assets
acquired and liabilities assumed based on their estimated fair values at the dates of acquisition. These acquisitions individually and in the
aggregate are not material to the Company's operations. Operations of the acquired companies have been included in the operations of the
Company since the date of the respective acquisition.
101
Weighted Average
Amortization Period
(In years)
June 30,
2009 2008
Amortized intangible assets:
Brand assets and trade names
39
39
Customer lists
10
10
Franchise agreements
22
21
Lease intangibles
20
20
Non
-
compete agreements
4
5
Other
18
17
Total
26
26
Fiscal Year
(Dollars in thousands)
2010
$
9,742
2011
9,540
2012
9,327
2013
9,049
2014
8,868
2009
2008
2007
(Dollars in thousands)
Cash paid during the year for:
Interest
$
40,992
$
46,547
$
40,805
Income taxes, net of refunds
21,878
49,148
71,770