Supercuts 2009 Annual Report Download - page 140
Download and view the complete annual report
Please find page 140 of the 2009 Supercuts annual report below. You can navigate through the pages in the report by either clicking on the pages listed below, or by using the keyword search tool below to find specific information within the annual report.-
 1
1 -
2
-
3
-
4
-
5
-
6
-
7
-
8
-
9
-
10
-
11
-
12
-
13
-
14
-
15
-
16
-
17
-
18
-
19
-
20
-
21
-
22
-
23
-
24
-
25
-
26
-
27
-
28
-
29
-
30
-
31
-
32
-
33
-
34
-
35
-
36
-
37
-
38
-
39
-
40
-
41
-
42
-
43
-
44
-
45
-
46
-
47
-
48
-
49
-
50
-
51
-
52
-
53
-
54
-
55
-
56
-
57
-
58
-
59
-
60
-
61
-
62
-
63
-
64
-
65
-
66
-
67
-
68
-
69
-
70
-
71
-
72
-
73
-
74
-
75
-
76
-
77
-
78
-
79
-
80
-
81
-
82
-
83
-
84
-
85
-
86
-
87
-
88
-
89
-
90
-
91
-
92
-
93
-
94
-
95
-
96
-
97
-
98
-
99
-
100
-
101
-
102
-
103
-
104
-
105
-
106
-
107
-
108
-
109
-
110
-
111
-
112
-
113
-
114
-
115
-
116
-
117
-
118
-
119
-
120
-
121
-
122
-
123
-
124
-
125
-
126
-
127
-
128
-
129
-
 130
130 -
 131
131 -
 132
132 -
 133
133 -
 134
134 -
 135
135 -
 136
136 -
 137
137 -
 138
138 -
 139
139 -
 140
140 -
 141
141 -
 142
142 -
 143
143 -
 144
144 -
 145
145 -
 146
146 -
 147
147 -
 148
148 -
 149
149 -
 150
150 -
151
-
152
-
153
-
154
-
155
-
156
-
157
-
158
-
159
-
160
 |
 |

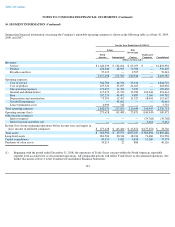
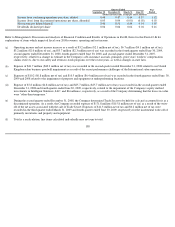
Refer to Management's Discussion and Analysis of Financial Condition and Results of Operations in Part II, Item 6 in this Form 10-K for
explanations of items which impacted fiscal year 2008 revenues, operating and net income.
(a)
Quarter Ended
Year
Ended
September 30
December 31
March 31
June 30
(Dollars in thousands, except per share amounts)
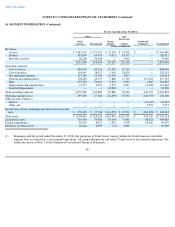
Income from continuing operations per share, diluted
0.44
0.47
0.44
0.57
1.92
Income (loss) from discontinued operations per share, diluted(f)
0.03
0.04
(0.00
)
(0.03
)
0.03
Net income per diluted share(f)
0.46
0.51
0.44
0.54
1.95
Dividends declared per share
0.04
0.04
0.04
0.04
0.16
Operating income and net income increase as a result of $3.2 million ($2.1 million net of tax), $6.7 million ($4.1 million net of tax),
$3.2 million ($2.0 million of tax), and $3.7 million ($2.3 million net of tax) was recorded in the fourth quarter ended June 30, 2009,
second quarter ended December 31, 2008, fourth quarter ended June 30, 2008, and second quarter ended December 31, 2007,
respectively, related to a change in estimate in the Company's self-insurance accruals, primarily, prior years' workers' compensation
claims reserves, due to our safety and return-to-work programs over the recent years, as well as changes in state laws.
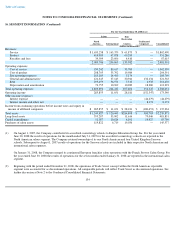
(b) Expense of $41.7 million ($40.3 million net of tax) was recorded in the second quarter ended December 31, 2008 related to our United
Kingdom salon business goodwill impairment as a result of the recent performance challenges of the International salon operations.
(c)
Expenses of $10.2 ($6.8 million net of tax) and $10.5 million ($6.4 million net of tax) was recorded in the fourth quarters ended June, 30,
2009 and 2008 related to the impairment of property and equipment at underperforming locations.
(d) Expense of $7.8 million ($4.8 million net of tax) and $25.7 million ($25.7 million net of tax) was recorded in the second quarter ended
December 31, 2008 and fourth quarter ended June 30, 2009, respectively, related to the impairment of the Company's equity method
investments in Intelligent Nutrients, LLC. and Provalliance, respectively, as a result of the Company determining that the losses in value
were "other-than-temporary."
(e)
During the second quarter ended December 31, 2008, the Company determined Trade Secret to be held for sale and accounted for it as a
discontinued operation. As a result, the Company recorded expense of $171.8 million ($115.8 million net of tax) as a result of the write-
off of the net assets associated with the sale of Trade Secret. Expenses of $11.3 million net of tax and $0.2 million net of tax were
recorded in the third quarter ended March 31, 2009 and fourth quarter ended June 30, 2009, respectively for the incremental write-off of
primarily inventories and property and equipment.
(f)
Total is a recalculation; line items calculated individually may not sum to total.
138