Supercuts 2009 Annual Report Download - page 52
Download and view the complete annual report
Please find page 52 of the 2009 Supercuts annual report below. You can navigate through the pages in the report by either clicking on the pages listed below, or by using the keyword search tool below to find specific information within the annual report.-
 1
1 -
2
-
3
-
4
-
5
-
6
-
7
-
8
-
9
-
10
-
11
-
12
-
13
-
14
-
15
-
16
-
17
-
18
-
19
-
20
-
21
-
22
-
23
-
24
-
25
-
26
-
27
-
28
-
29
-
30
-
31
-
32
-
33
-
34
-
35
-
36
-
37
-
38
-
39
-
40
-
41
-
 42
42 -
 43
43 -
 44
44 -
 45
45 -
 46
46 -
 47
47 -
 48
48 -
 49
49 -
 50
50 -
 51
51 -
 52
52 -
 53
53 -
 54
54 -
 55
55 -
 56
56 -
 57
57 -
 58
58 -
 59
59 -
 60
60 -
 61
61 -
 62
62 -
63
-
64
-
65
-
66
-
67
-
68
-
69
-
70
-
71
-
72
-
73
-
74
-
75
-
76
-
77
-
78
-
79
-
80
-
81
-
82
-
83
-
84
-
85
-
86
-
87
-
88
-
89
-
90
-
91
-
92
-
93
-
94
-
95
-
96
-
97
-
98
-
99
-
100
-
101
-
102
-
103
-
104
-
105
-
106
-
107
-
108
-
109
-
110
-
111
-
112
-
113
-
114
-
115
-
116
-
117
-
118
-
119
-
120
-
121
-
122
-
123
-
124
-
125
-
126
-
127
-
128
-
129
-
130
-
131
-
132
-
133
-
134
-
135
-
136
-
137
-
138
-
139
-
140
-
141
-
142
-
143
-
144
-
145
-
146
-
147
-
148
-
149
-
150
-
151
-
152
-
153
-
154
-
155
-
156
-
157
-
158
-
159
-
160
 |
 |

Table of Contents
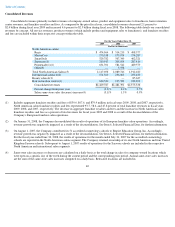
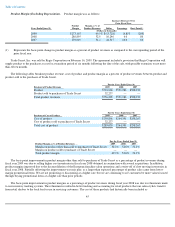
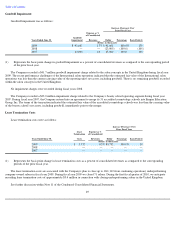
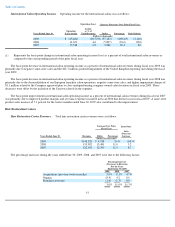
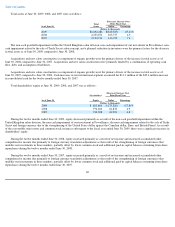
Interest Expense
Interest expense was as follows:
(1)
Increase (Decrease) Over
Prior Fiscal Year
Years Ended June 30, Interest
Expense as %
of Consolidated
Revenues Dollar
Percentage
Basis Point(1)
(Dollars in thousands)
2009
$
39,768
1.6
%
$
(4,511
)
(10.2
)%
(20
)
2008
44,279
1.8
2,632
6.3
—
2007
41,647
1.8
6,734
19.3
20
Represents the basis point change in interest expense as a percent of consolidated revenues as compared to the corresponding period of
the prior fiscal year.
The basis point improvement in interest as a percent of consolidated revenues during the twelve months ended June 30, 2009 was primarily
due to lower average interest rates on variable rate debt and decreased debt levels as a result of the Company's commitment to reduce debt levels.
Interest as a percent of consolidated revenues during the twelve months ended June 30, 2008 was consistent with the twelve months ended
June 30, 2007.
The basis point increase in interest expense as a percent of consolidated revenues during fiscal year 2007 was primarily due to increased
debt levels due to the Company's repurchase of $79.7 million of our outstanding common stock, acquisitions and the timing of income tax
payments during the fiscal year.
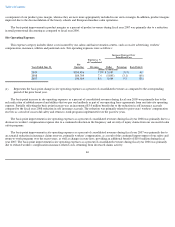
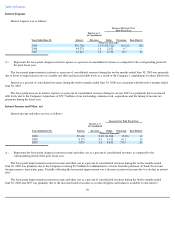
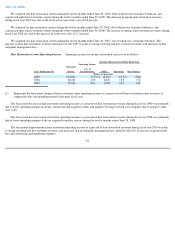
Interest Income and Other, net
Interest income and other, net was as follows:
(1)
Increase Over Prior Fiscal Year
Years Ended June 30,
Interest
Income as %
of Consolidated
Revenues
Dollar
Percentage
Basis Point(1)
(Dollars in thousands)
2009
$
9,461
0.4
%
$
1,288
15.8
%
10
2008
8,173
0.3
3,120
61.7
10
2007
5,053
0.2
4,432
713.7
20
Represents the basis point change in interest income and other, net as a percent of consolidated revenues as compared to the
corresponding period of the prior fiscal year.
The basis point improvement in interest income and other, net as a percent of consolidated revenues during the twelve months ended
June 30, 2009 was primarily due to the Company receiving $2.9 million for administrative services from the purchaser of Trade Secret and
foreign currency transaction gains. Partially offsetting the basis point improvement was a decrease in interest income due to a decline in interest
rates.
The basis point improvement in interest income and other, net as a percent of consolidated revenues during the twelve months ended
June 30, 2008 and 2007 was primarily due to the increased interest income as a result of higher cash balances available to earn interest.
50