Supercuts 2009 Annual Report Download - page 139
Download and view the complete annual report
Please find page 139 of the 2009 Supercuts annual report below. You can navigate through the pages in the report by either clicking on the pages listed below, or by using the keyword search tool below to find specific information within the annual report.-
 1
1 -
2
-
3
-
4
-
5
-
6
-
7
-
8
-
9
-
10
-
11
-
12
-
13
-
14
-
15
-
16
-
17
-
18
-
19
-
20
-
21
-
22
-
23
-
24
-
25
-
26
-
27
-
28
-
29
-
30
-
31
-
32
-
33
-
34
-
35
-
36
-
37
-
38
-
39
-
40
-
41
-
42
-
43
-
44
-
45
-
46
-
47
-
48
-
49
-
50
-
51
-
52
-
53
-
54
-
55
-
56
-
57
-
58
-
59
-
60
-
61
-
62
-
63
-
64
-
65
-
66
-
67
-
68
-
69
-
70
-
71
-
72
-
73
-
74
-
75
-
76
-
77
-
78
-
79
-
80
-
81
-
82
-
83
-
84
-
85
-
86
-
87
-
88
-
89
-
90
-
91
-
92
-
93
-
94
-
95
-
96
-
97
-
98
-
99
-
100
-
101
-
102
-
103
-
104
-
105
-
106
-
107
-
108
-
109
-
110
-
111
-
112
-
113
-
114
-
115
-
116
-
117
-
118
-
119
-
120
-
121
-
122
-
123
-
124
-
125
-
126
-
127
-
128
-
 129
129 -
 130
130 -
 131
131 -
 132
132 -
 133
133 -
 134
134 -
 135
135 -
 136
136 -
 137
137 -
 138
138 -
 139
139 -
 140
140 -
 141
141 -
 142
142 -
 143
143 -
 144
144 -
 145
145 -
 146
146 -
 147
147 -
 148
148 -
 149
149 -
150
-
151
-
152
-
153
-
154
-
155
-
156
-
157
-
158
-
159
-
160
 |
 |

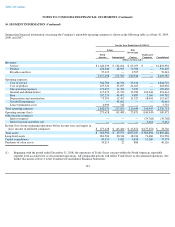
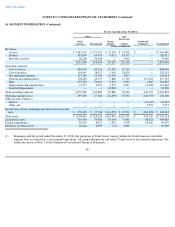
QUARTERLY FINANCIAL DATA
(Unaudited)
Refer to Management's Discussion and Analysis of Financial Condition and Results of Operations in Part II, Item 6 in this Form 10-K for
explanations of items which impacted fiscal year 2009 revenues, operating and net income.
137
Quarter Ended
Year
Ended
September 30
December 31
March 31 June 30
(Dollars in thousands, except per share amounts)
2009
Revenues
$
613,529
$
587,426
$
604,086
$
624,746
$
2,429,787
Gross margin, excluding depreciation
270,522
255,936
260,788
275,160
1,062,406
Operating income (loss)(a)(b)(c)
34,037
(6,649
)
37,072
44,613
109,073
Income (loss) from continuing operations(a)(b)(c)(d)
16,086
(25,786
)
21,025
(4,355
)
6,970
Loss from discontinued operations(e)
(1,600
)
(117,466
)
(12,171
)
(199
)
(131,436
)
Net income (loss)(a)(b)(c)(d)(e)
14,486
(143,252
)
8,854
(4,554
)
(124,646
)
Income (loss) from continuing operations per share, basic
0.38
(0.60
)
0.49
(0.10
)
0.16
Loss from discontinued operations per share, basic(e)
(0.04
)
(2.74
)
(0.28
)
(0.00
)
(3.06
)
Net income (loss) per basic share(f)
0.34
(3.34
)
0.21
(0.11
)
(2.90
)
Income (loss) from continuing operations per share, diluted
0.37
(0.60
)
0.49
(0.10
)
0.16
Loss from discontinued operations per share, diluted(e)
(0.04
)
(2.74
)
(0.28
)
(0.00
)
(3.05
)
Net income (loss) per diluted share(f)
0.34
(3.34
)
0.21
(0.11
)
(2.89
)
Dividends declared per share
0.04
0.04
0.04
0.04
0.16
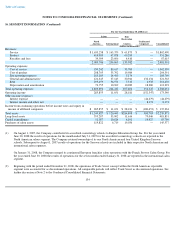
Quarter Ended
Year
Ended
September 30
December 31
March 31
June 30
(Dollars in thousands, except per share amounts)
2008
Revenues
$
607,330
$
614,666
$
618,857
$
640,538
$
2,481,391
Gross margin, excluding depreciation
266,158
264,669
271,047
284,952
1,086,826
Operating income(a)(c)
38,946
41,644
43,141
49,609
173,340
Income from continuing operations
19,448
20,725
19,146
24,582
83,901
Income (loss) from discontinued operations(a)(b)(c)
1,151
1,831
(178
)
(1,501
)
1,303
Net income(a)(c)
20,599
22,556
18,968
23,081
85,204
Income from continuing operations per share, basic(f)
0.44
0.48
0.45
0.58
1.94
Income (loss) from discontinued operations per share, basic(f)
0.03
0.04
(0.01
)
(0.04
)
0.03
Net income per basic share
0.47
0.52
0.44
0.54
1.97