Supercuts 2009 Annual Report Download - page 42
Download and view the complete annual report
Please find page 42 of the 2009 Supercuts annual report below. You can navigate through the pages in the report by either clicking on the pages listed below, or by using the keyword search tool below to find specific information within the annual report.-
 1
1 -
2
-
3
-
4
-
5
-
6
-
7
-
8
-
9
-
10
-
11
-
12
-
13
-
14
-
15
-
16
-
17
-
18
-
19
-
20
-
21
-
22
-
23
-
24
-
25
-
26
-
27
-
28
-
29
-
30
-
31
-
 32
32 -
 33
33 -
 34
34 -
 35
35 -
 36
36 -
 37
37 -
 38
38 -
 39
39 -
 40
40 -
 41
41 -
 42
42 -
 43
43 -
 44
44 -
 45
45 -
 46
46 -
 47
47 -
 48
48 -
 49
49 -
 50
50 -
 51
51 -
 52
52 -
53
-
54
-
55
-
56
-
57
-
58
-
59
-
60
-
61
-
62
-
63
-
64
-
65
-
66
-
67
-
68
-
69
-
70
-
71
-
72
-
73
-
74
-
75
-
76
-
77
-
78
-
79
-
80
-
81
-
82
-
83
-
84
-
85
-
86
-
87
-
88
-
89
-
90
-
91
-
92
-
93
-
94
-
95
-
96
-
97
-
98
-
99
-
100
-
101
-
102
-
103
-
104
-
105
-
106
-
107
-
108
-
109
-
110
-
111
-
112
-
113
-
114
-
115
-
116
-
117
-
118
-
119
-
120
-
121
-
122
-
123
-
124
-
125
-
126
-
127
-
128
-
129
-
130
-
131
-
132
-
133
-
134
-
135
-
136
-
137
-
138
-
139
-
140
-
141
-
142
-
143
-
144
-
145
-
146
-
147
-
148
-
149
-
150
-
151
-
152
-
153
-
154
-
155
-
156
-
157
-
158
-
159
-
160
 |
 |

Table of Contents
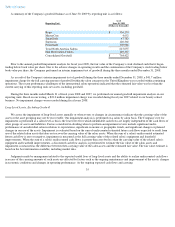
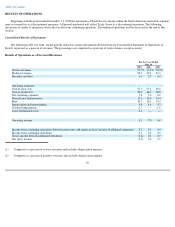
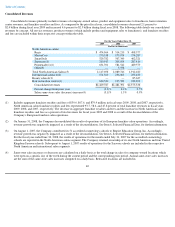
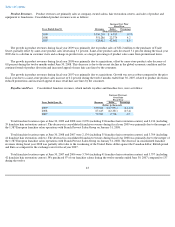
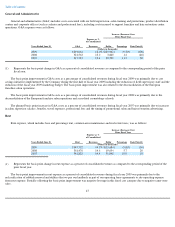
Consolidated Revenues
Consolidated revenues primarily include revenues of company-owned salons, product and equipment sales to franchisees, hair restoration
center revenues, and franchise royalties and fees. As compared to the prior fiscal year, consolidated revenues decreased 2.1 percent to
$2.4 billion during fiscal year 2009 and increased 4.6 percent to $2.5 billion during fiscal year 2008. The following table details our consolidated
revenues by concept. All service revenues, product revenues (which include product and equipment sales to franchisees), and franchise royalties
and fees are included within their respective concept within the table.
(1)
For the Years Ended June 30,
2009
2008
2007
(Dollars in thousands)
North American salons:
Regis
$
474,964
$
514,219
$
498,577
MasterCuts
170,338
175,974
174,287
SmartStyle
529,782
507,349
462,321
Supercuts(1)
310,913
305,104
287,416
Promenade(1)(6)
631,701
581,542
489,579
Other(3)
—
5,558
—
Total North American Salons(5)
2,117,698
2,089,746
1,912,180
International salons(1)(2)
171,569
256,063
253,430
Beauty schools(3)
—
—
85,627
Hair restoration centers(1)
140,520
135,582
122,101
Consolidated revenues
$
2,429,787
$
2,481,391
$
2,373,338
Percent change from prior year
(2.1
)%
4.6
%
9.5
%
Salon same
-
store sales (decrease) increase(4)
(3.1
)%
1.5
%
0.9
%
Includes aggregate franchise royalties and fees of $39.6, $67.6, and $79.9 million in fiscal years 2009, 2008, and 2007, respectively.
North American salon franchise royalties and fees represented 93.7, 58.6, and 47.8 percent of total franchise revenues in fiscal years
2009, 2008, and 2007, respectively. The decrease in aggregate franchise royalties and fees and the increase in North American salon
franchise royalties and fees as a percent of total revenues for fiscal years 2009 and 2008 is a result of the deconsolidation of the
Company's European franchise salon operations.
(2)
On January 31, 2008, the Company deconsolidated the results of operations of its European franchise salon operations. Accordingly,
revenue growth was negatively impacted as a result of the deconsolidation. See Item 6, Selected Financial Data, for further information
(3) On August 1, 2007, the Company contributed its 51 accredited cosmetology schools to Empire Education Group, Inc. Accordingly,
revenue growth was negatively impacted as a result of the deconsolidation. See Item 6, Selected Financial Data, for further information.
For the fiscal year ended June 30, 2008, the results of operations for the month ended July 31, 2007 for the accredited cosmetology
schools are reported in the North American salons segment. The Company retained ownership of its one North American and four United
Kingdom Sassoon schools. Subsequent to August 1, 2007 results of operations for the Sassoon schools are included in the respective
North American and international salon segments.
(4)
Same
-
store sales increases or decreases are calculated on a daily basis as the total change in sales for company
-
owned locations which
were open on a specific day of the week during the current period and the corresponding prior period. Annual same-store sales increases
are the sum of the same-store sales increases computed on a daily basis. Relocated locations are included in
40