Supercuts 2009 Annual Report Download - page 50
Download and view the complete annual report
Please find page 50 of the 2009 Supercuts annual report below. You can navigate through the pages in the report by either clicking on the pages listed below, or by using the keyword search tool below to find specific information within the annual report.-
 1
1 -
2
-
3
-
4
-
5
-
6
-
7
-
8
-
9
-
10
-
11
-
12
-
13
-
14
-
15
-
16
-
17
-
18
-
19
-
20
-
21
-
22
-
23
-
24
-
25
-
26
-
27
-
28
-
29
-
30
-
31
-
32
-
33
-
34
-
35
-
36
-
37
-
38
-
39
-
 40
40 -
 41
41 -
 42
42 -
 43
43 -
 44
44 -
 45
45 -
 46
46 -
 47
47 -
 48
48 -
 49
49 -
 50
50 -
 51
51 -
 52
52 -
 53
53 -
 54
54 -
 55
55 -
 56
56 -
 57
57 -
 58
58 -
 59
59 -
 60
60 -
61
-
62
-
63
-
64
-
65
-
66
-
67
-
68
-
69
-
70
-
71
-
72
-
73
-
74
-
75
-
76
-
77
-
78
-
79
-
80
-
81
-
82
-
83
-
84
-
85
-
86
-
87
-
88
-
89
-
90
-
91
-
92
-
93
-
94
-
95
-
96
-
97
-
98
-
99
-
100
-
101
-
102
-
103
-
104
-
105
-
106
-
107
-
108
-
109
-
110
-
111
-
112
-
113
-
114
-
115
-
116
-
117
-
118
-
119
-
120
-
121
-
122
-
123
-
124
-
125
-
126
-
127
-
128
-
129
-
130
-
131
-
132
-
133
-
134
-
135
-
136
-
137
-
138
-
139
-
140
-
141
-
142
-
143
-
144
-
145
-
146
-
147
-
148
-
149
-
150
-
151
-
152
-
153
-
154
-
155
-
156
-
157
-
158
-
159
-
160
 |
 |

Table of Contents
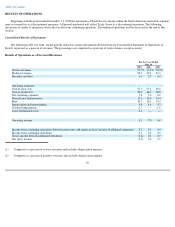
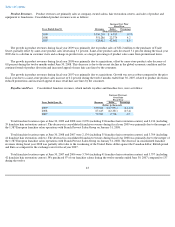
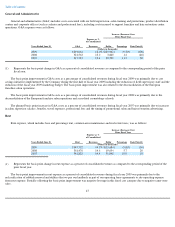
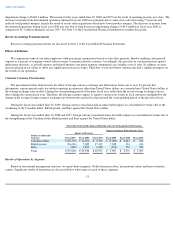
The basis point increase in rent expense as a percent of consolidated revenues during fiscal year 2008 was primarily due to rent expense
increasing at a faster rate than location same-store sales and the deconsolidation of the schools and European franchise salon operations, offset
by recent salon acquisitions having a lower occupancy cost.
The basis point increase in rent expense as a percent of consolidated revenues during fiscal years 2007 and 2006 was primarily due to rent
expense increasing at a faster rate than location same-store sales. Additionally, fiscal year 2007 is impacted by an extra week of rent in the
United Kingdom.
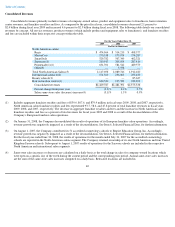
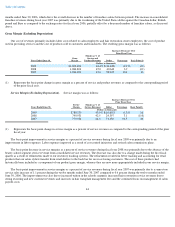
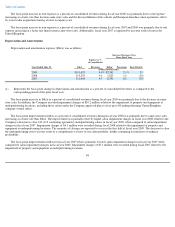
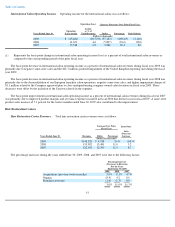
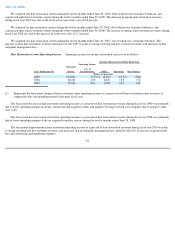
Depreciation and Amortization
Depreciation and amortization expense (D&A) was as follows:
(1)
Increase (Decrease) Over
Prior Fiscal Year
Years Ended June 30,
D&A
Expense as %
of Consolidated
Revenues
Dollar
Percentage
Basis Point(1)
(Dollars in thousands)
2009
$
115,655
4.8
%
$
2,362
2.1
%
20
2008
113,293
4.6
1,829
1.6
(10
)
2007
111,464
4.7
8,390
8.1
(10
)
Represents the basis point change in depreciation and amortization as a percent of consolidated revenues as compared to the
corresponding period of the prior fiscal year.
The basis point increase in D&A as a percent of consolidated revenues during fiscal year 2009 was primarily due to the decrease in same-
store sales. In addition, the Company recorded impairment charges of $10.2 million related to the impairment of property and equipment at
underperforming locations, including those salons under the Company approved plan to close up to 80 underperforming United Kingdom
company-owned salons.
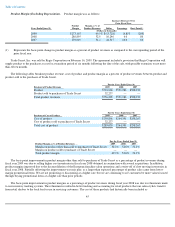
The basis point improvement in D&A as a percent of consolidated revenues during fiscal year 2008 was primarily due to same-store sales
increasing at a faster rate than D&A. The improvement was partially offset by higher salon impairment charges in fiscal year 2008 related to the
Company's decision to close 160 (112 continuing operations) underperforming salons in fiscal year 2009, when compared to salon impairment
charges in fiscal year 2007. Impairment charges of $6.1 million were recorded during fiscal 2008 related to the impairment of property and
equipment at underperforming locations. The majority of closings are expected to occur in the first half of fiscal year 2009. The decision to close
the underperforming stores was the result of a comprehensive review of our salon portfolio, further continuing our initiative to enhance
profitability.
The basis point improvement in D&A for fiscal year 2007 relates primarily to lower salon impairment charges in fiscal year 2007 when
compared to salon impairment charges in fiscal year 2006. Impairment charges of $5.1 million were recorded during fiscal 2007 related to the
impairment of property and equipment at underperforming locations.
48