Supercuts 2009 Annual Report Download - page 131
Download and view the complete annual report
Please find page 131 of the 2009 Supercuts annual report below. You can navigate through the pages in the report by either clicking on the pages listed below, or by using the keyword search tool below to find specific information within the annual report.-
 1
1 -
2
-
3
-
4
-
5
-
6
-
7
-
8
-
9
-
10
-
11
-
12
-
13
-
14
-
15
-
16
-
17
-
18
-
19
-
20
-
21
-
22
-
23
-
24
-
25
-
26
-
27
-
28
-
29
-
30
-
31
-
32
-
33
-
34
-
35
-
36
-
37
-
38
-
39
-
40
-
41
-
42
-
43
-
44
-
45
-
46
-
47
-
48
-
49
-
50
-
51
-
52
-
53
-
54
-
55
-
56
-
57
-
58
-
59
-
60
-
61
-
62
-
63
-
64
-
65
-
66
-
67
-
68
-
69
-
70
-
71
-
72
-
73
-
74
-
75
-
76
-
77
-
78
-
79
-
80
-
81
-
82
-
83
-
84
-
85
-
86
-
87
-
88
-
89
-
90
-
91
-
92
-
93
-
94
-
95
-
96
-
97
-
98
-
99
-
100
-
101
-
102
-
103
-
104
-
105
-
106
-
107
-
108
-
109
-
110
-
111
-
112
-
113
-
114
-
115
-
116
-
117
-
118
-
119
-
120
-
 121
121 -
 122
122 -
 123
123 -
 124
124 -
 125
125 -
 126
126 -
 127
127 -
 128
128 -
 129
129 -
 130
130 -
 131
131 -
 132
132 -
 133
133 -
 134
134 -
 135
135 -
 136
136 -
 137
137 -
 138
138 -
 139
139 -
 140
140 -
 141
141 -
142
-
143
-
144
-
145
-
146
-
147
-
148
-
149
-
150
-
151
-
152
-
153
-
154
-
155
-
156
-
157
-
158
-
159
-
160
 |
 |

Table of Contents
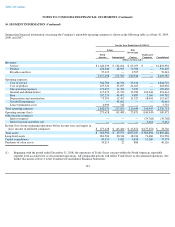
NOTES TO CONSOLIDATED FINANCIAL STATEMENTS (Continued)
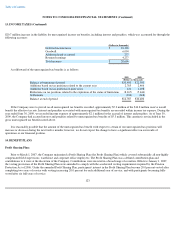
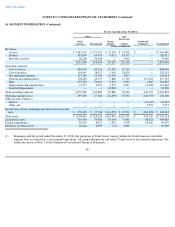
15. SHAREHOLDERS' EQUITY (Continued)
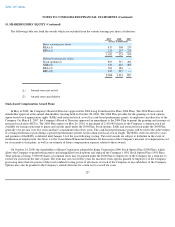
All options granted relate to stock option plans that have been approved by the shareholders of the Company. Stock options granted in fiscal
years 2009 and 2008 were granted under the 2004 Plan. Stock options granted in fiscal year 2007 were granted under the 2000 Plan.
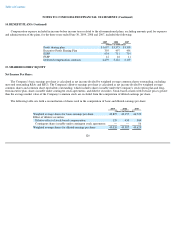
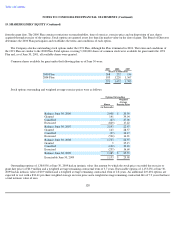
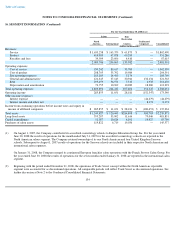
A rollforward of RSAs, RSUs and SARs outstanding, as well as other relevant terms of the awards, were as follows:
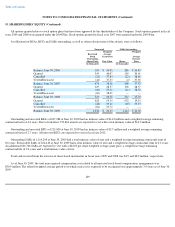
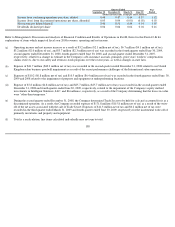
Outstanding and unvested RSAs of 817,288 at June 30, 2009 had an intrinsic value of $14.2 million and a weighted average remaining
contractual term of 4.4 years. Due to forfeitures 799,881 awards are expected to vest with a total intrinsic value of $13.9 million.
Outstanding and unvested RSUs of 215,000 at June 30, 2009 had an intrinsic value of $3.7 million and a weighted average remaining
contractual term of 2.7 years. All unvested RSUs are expected to vest in fiscal year 2012.
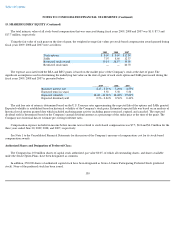
Outstanding SARs of 1,114,200 at June 30, 2009 had a total intrinsic value of zero and a weighted average remaining contractual term of
8.6 years. Exercisable SARs of 264,410 at June 30, 2009 had a total intrinsic value of zero and a weighted average contractual term of 6.2 years.
An additional 836,766 SARs are expected to vest with a $22.83 per share weighted average grant price, a weighted average remaining
contractual life of 9.4 years and a total intrinsic value of zero.
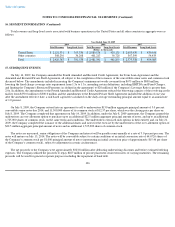
Total cash received from the exercise of share-based instruments in fiscal years 2009 and 2008 was $3.9 and $8.9 million, respectively.
As of June 30, 2009, the total unrecognized compensation cost related to all unvested stock-based compensation arrangements was
$30.9 million. The related weighted average period over which such cost is expected to be recognized was approximately 3.9 years as of June 30,
2009.
129
Nonvested
SARs Outstanding
Restricted
Stock
Outstanding
Shares/Units
Weighted
Average
Grant Date
Fair Value
Shares
Weighted
Average
Exercise
Price
(in thousands)
(in thousands)
Balance, June 30, 2006
193
$
36.92
286
$
36.87
Granted
343
40.07
139
39.01
Cancelled
(21
)
37.84
(23
)
38.41
Vested/Exercised
(41
)
37.33
(2
)
37.92
Balance, June 30, 2007
474
38.36
400
37.53
Granted
125
28.57
138
28.57
Cancelled
(10
)
37.71
(11
)
38.53
Vested/Exercised
(66
)
38.05
—
—
Balance, June 30, 2008
523
36.76
527
35.70
Granted
618
19.14
632
19.14
Cancelled
(28
)
35.41
(45
)
35.73
Vested/Exercised
(81
)
35.72
—
—
Balance, June 30, 2009
1,032
$
26.33
1,114
$
26.30