Supercuts 2009 Annual Report Download - page 47
Download and view the complete annual report
Please find page 47 of the 2009 Supercuts annual report below. You can navigate through the pages in the report by either clicking on the pages listed below, or by using the keyword search tool below to find specific information within the annual report.-
 1
1 -
2
-
3
-
4
-
5
-
6
-
7
-
8
-
9
-
10
-
11
-
12
-
13
-
14
-
15
-
16
-
17
-
18
-
19
-
20
-
21
-
22
-
23
-
24
-
25
-
26
-
27
-
28
-
29
-
30
-
31
-
32
-
33
-
34
-
35
-
36
-
 37
37 -
 38
38 -
 39
39 -
 40
40 -
 41
41 -
 42
42 -
 43
43 -
 44
44 -
 45
45 -
 46
46 -
 47
47 -
 48
48 -
 49
49 -
 50
50 -
 51
51 -
 52
52 -
 53
53 -
 54
54 -
 55
55 -
 56
56 -
 57
57 -
58
-
59
-
60
-
61
-
62
-
63
-
64
-
65
-
66
-
67
-
68
-
69
-
70
-
71
-
72
-
73
-
74
-
75
-
76
-
77
-
78
-
79
-
80
-
81
-
82
-
83
-
84
-
85
-
86
-
87
-
88
-
89
-
90
-
91
-
92
-
93
-
94
-
95
-
96
-
97
-
98
-
99
-
100
-
101
-
102
-
103
-
104
-
105
-
106
-
107
-
108
-
109
-
110
-
111
-
112
-
113
-
114
-
115
-
116
-
117
-
118
-
119
-
120
-
121
-
122
-
123
-
124
-
125
-
126
-
127
-
128
-
129
-
130
-
131
-
132
-
133
-
134
-
135
-
136
-
137
-
138
-
139
-
140
-
141
-
142
-
143
-
144
-
145
-
146
-
147
-
148
-
149
-
150
-
151
-
152
-
153
-
154
-
155
-
156
-
157
-
158
-
159
-
160
 |
 |
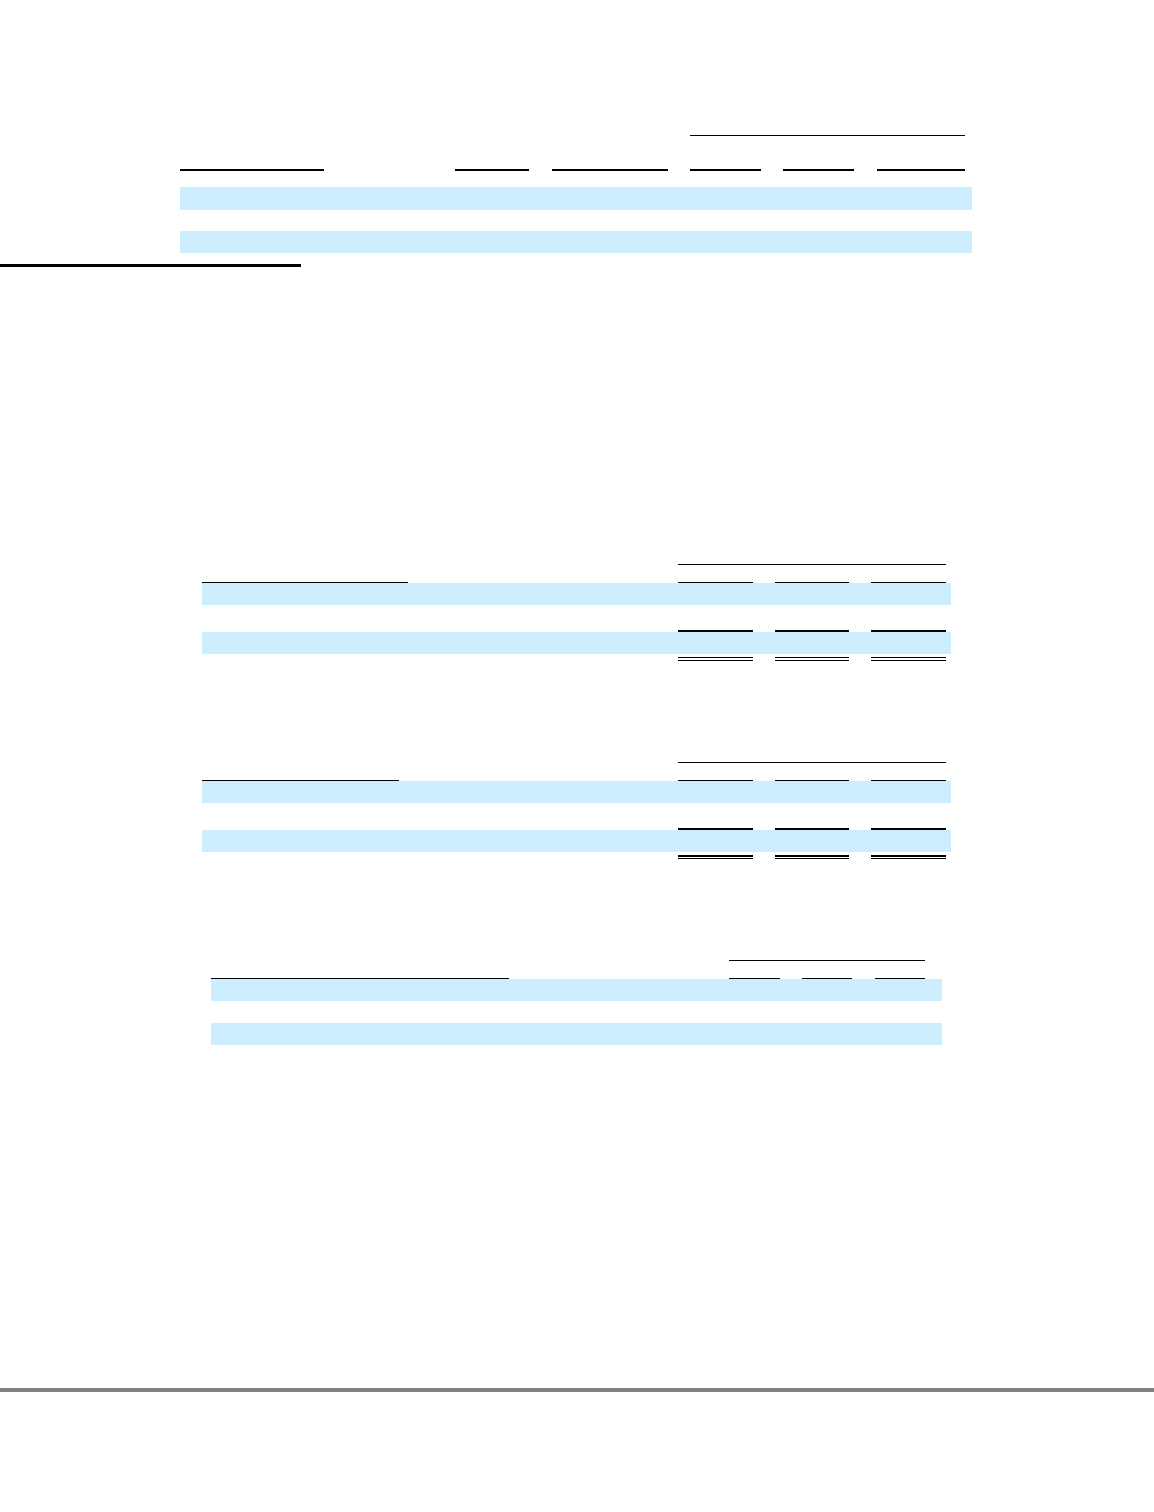
Table of Contents
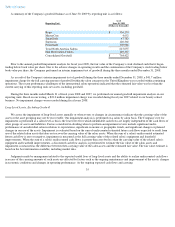
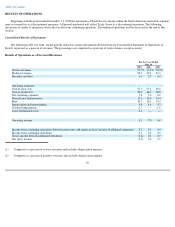
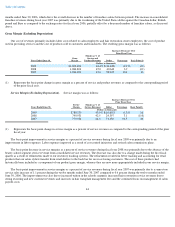
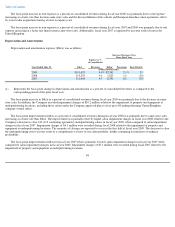
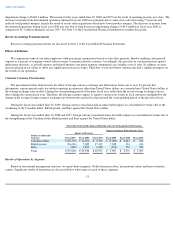
Product Margin (Excluding Depreciation). Product margin was as follows:
(1)
Increase (Decrease) Over
Prior Fiscal Year
Years Ended June 30, Product
Margin Margin as % of
Product Revenues
Dollar
Percentage
Basis Point(1)
(Dollars in thousands)
2009
$
273,167
49.1
%
$
(13,728
)
(4.8
)%
(290
)
2008
286,895
52.0
16,246
6.0
80
2007
270,649
51.2
24,517
10.0
60
Represents the basis point change in product margin as a percent of product revenues as compared to the corresponding period of the
prior fiscal year.
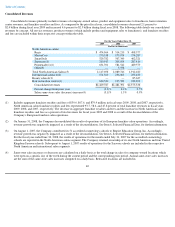
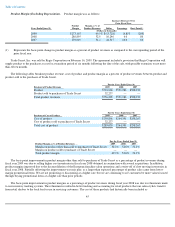
Trade Secret, Inc. was sold by Regis Corporation on February 16, 2009. The agreement included a provision that Regis Corporation will
supply product to the purchaser at cost for a transition period of six months following the date of the sale, with possible extension to not more
than eleven months.
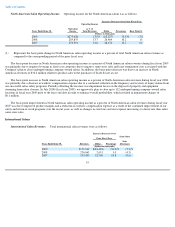
The following tables breakout product revenue, cost of product and product margin as a percent of product revenues between product and
product sold to the purchaser of Trade Secret.
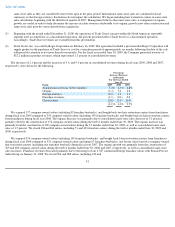
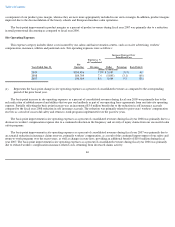
The basis point improvement in product margin other than sold to purchaser of Trade Secret as a percentage of product revenues during
fiscal year 2009 was due to selling higher cost inventories in fiscal year 2008 obtained in conjunction with several acquisitions. In addition,
product margins improved due to the deconsolidation of the European franchise salon operations and a write-off of slow moving inventories in
fiscal year 2008. Partially offsetting the improvement was mix play, as a larger than expected percentage of product sales came from lower-
margin promotional items. We are not promoting or discounting at a higher rate, but we are continuing to see customers be more value-focused
through buying promotional items at a higher rate than prior periods.
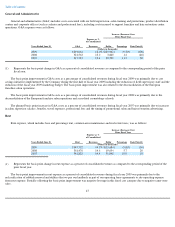
The basis point improvement in product margins as a percentage of product revenues during fiscal year 2008 was due to refinements made
to our inventory tracking systems. The refinements resulted in better tracking and accounting for retail products that our salon stylists transfer
from retail shelves to the back bar for use in servicing customers. The cost of these products had historically been included as
45
For the Years Ended June 30,
Breakout of Product Revenue
2009
2008
2007
Product
$
523,968
$
551,286
$
528,912
Product sold to purchaser of Trade Secret
32,237
—
—
Total product revenues
$
556,205
$
551,286
$
528,912
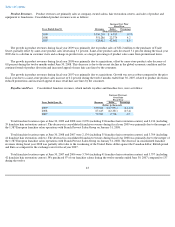
For the Years Ended June 30,
Breakout of Cost of Product
2009
2008
2007
Cost of product
$
250,801
$
264,391
$
258,263
Cost of product sold to purchaser of Trade Secret
32,237
—
—
Total cost of product
$
283,038
$
264,391
$
258,263
For the Years Ended June 30,
Product Margin as % of Product Revenues
2009
2008
2007
Margin on product other than sold to purchaser of Trade Secret
52.1
%
52.0
%
51.2
%
Margin on product sold to purchaser of Trade Secret
—
—
—
Total product margin
49.1
%
52.0
%
51.2
%