Supercuts 2009 Annual Report Download - page 102
Download and view the complete annual report
Please find page 102 of the 2009 Supercuts annual report below. You can navigate through the pages in the report by either clicking on the pages listed below, or by using the keyword search tool below to find specific information within the annual report.-
 1
1 -
2
-
3
-
4
-
5
-
6
-
7
-
8
-
9
-
10
-
11
-
12
-
13
-
14
-
15
-
16
-
17
-
18
-
19
-
20
-
21
-
22
-
23
-
24
-
25
-
26
-
27
-
28
-
29
-
30
-
31
-
32
-
33
-
34
-
35
-
36
-
37
-
38
-
39
-
40
-
41
-
42
-
43
-
44
-
45
-
46
-
47
-
48
-
49
-
50
-
51
-
52
-
53
-
54
-
55
-
56
-
57
-
58
-
59
-
60
-
61
-
62
-
63
-
64
-
65
-
66
-
67
-
68
-
69
-
70
-
71
-
72
-
73
-
74
-
75
-
76
-
77
-
78
-
79
-
80
-
81
-
82
-
83
-
84
-
85
-
86
-
87
-
88
-
89
-
90
-
91
-
 92
92 -
 93
93 -
 94
94 -
 95
95 -
 96
96 -
 97
97 -
 98
98 -
 99
99 -
 100
100 -
 101
101 -
 102
102 -
 103
103 -
 104
104 -
 105
105 -
 106
106 -
 107
107 -
 108
108 -
 109
109 -
 110
110 -
 111
111 -
 112
112 -
113
-
114
-
115
-
116
-
117
-
118
-
119
-
120
-
121
-
122
-
123
-
124
-
125
-
126
-
127
-
128
-
129
-
130
-
131
-
132
-
133
-
134
-
135
-
136
-
137
-
138
-
139
-
140
-
141
-
142
-
143
-
144
-
145
-
146
-
147
-
148
-
149
-
150
-
151
-
152
-
153
-
154
-
155
-
156
-
157
-
158
-
159
-
160
 |
 |
Table of Contents
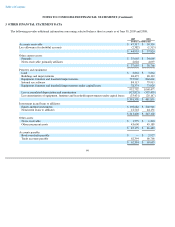
NOTES TO CONSOLIDATED FINANCIAL STATEMENTS (Continued)
3. OTHER FINANCIAL STATEMENT DATA (Continued)
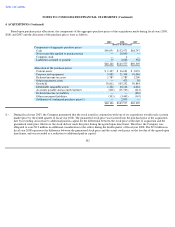
The following provides additional information concerning the other intangibles, net, balance sheet account as of June 30, 2009 and 2008:
(1)
2009
2008
(Dollars in thousands)
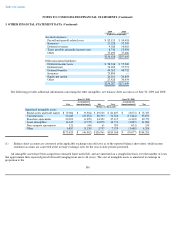
Accrued expenses:
Payroll and payroll related costs
$
82,153
$
94,418
Insurance
21,228
52,345
Deferred revenues
9,026
10,062
Taxes payable, primarily income taxes
8,741
13,094
Other
35,490
37,686
$
156,638
$
207,605
Other noncurrent liabilities:
Deferred income taxes
$
58,338
$
55,900
Deferred rent
53,294
57,751
Deferred benefits
49,262
48,732
Insurance
23,804
—
Equity put option
24,161
24,803
Other
27,428
30,454
$
236,287
$
217,640
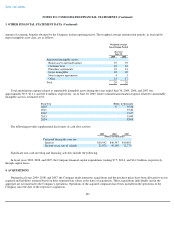
June 30, 2009
June 30, 2008
Cost
Accumulated
Amortization(1)
Net
Cost
Accumulated
Amortization(1)
Net
(Dollars in thousands)
Amortized intangible assets:
Brand assets and trade names
$
79,064
$
(9,964
)
$
69,100
$
81,407
$
(8,072
)
$
73,335
Customer lists
52,045
(23,252
)
28,793
51,316
(17,444
)
33,872
Franchise agreements
20,691
(6,299
)
14,392
27,115
(6,363
)
20,752
Lease intangibles
14,615
(3,737
)
10,878
14,771
(2,887
)
11,884
Non
-
compete agreements
121
(60
)
61
785
(631
)
154
Other
6,887
(3,150
)
3,737
7,974
(3,680
)
4,294
$
173,423
$
(46,462
)
$
126,961
$
183,368
$
(39,077
)
$
144,291
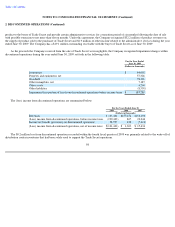
Balance sheet accounts are converted at the applicable exchange rates effective as of the reported balance sheet dates, while income
statement accounts are converted at the average exchange rates for the year-to-date periods presented.
All intangible assets have been assigned an estimated finite useful life, and are amortized on a straight-line basis over the number of years
that approximate their expected period of benefit (ranging from one to 40 years). The cost of intangible assets is amortized to earnings in
proportion to the
100